

- October 1, 2021
- Posted by: Tradingshot Articles
- Category: Stock Indices
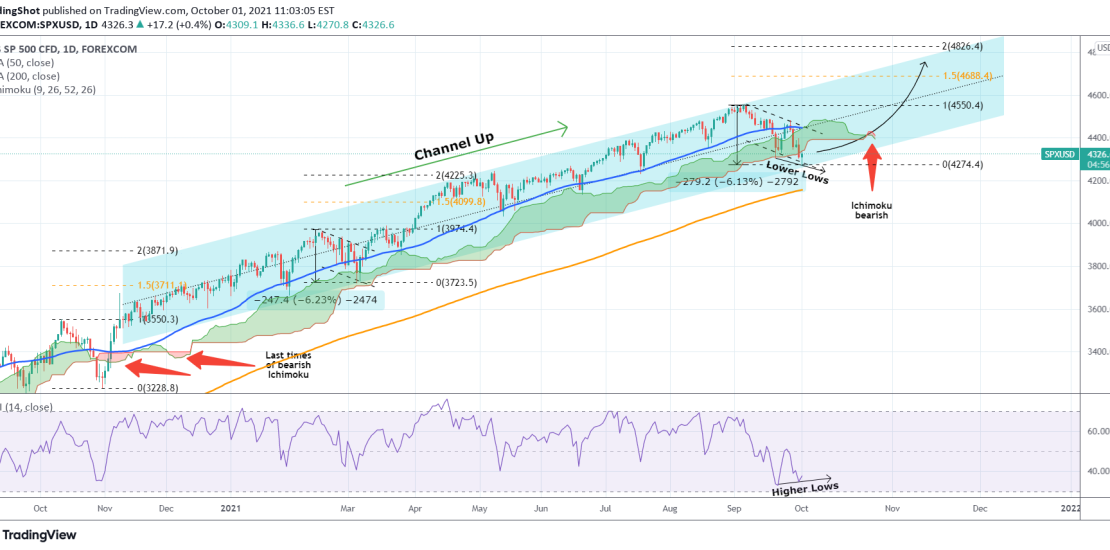
S&P has been trading within a long-term Channel Up ever since the aggressive rebound straight after the November 2020 U.S. elections. Today the price just hit the bottom (Higher Lows trend-line) of that Channel.
There are two high probability scenarios arising after September’s pull-back:
a) This pull-back is similar to late February – early March 2021 (both on -6% pull-backs that hit the bottom of the Channel Up.
b) It is similar to the October 30 2020 bottom itself (elections low) as they both broke below the Ichimoku Cloud. In fact the last two times before today that the Ichimoku indicator turned bearish was on December 02 2020 and October 29 2020.
On top of that the 1D RSI is on a bullish divergence as its been on Higher Lows since Sept 20 while the price is on Lower Lows, indicating that the selling might be getting weaker.
If SPX materializes one of those scenarios then we may expect first 4688 and then 4826 by December which is the 1.5 and 2.0 Fibonacci extensions respectively, as both of those a) b) patterns reached those extensions.
Tradingview link: