

- October 1, 2021
- Posted by: Tradingshot Articles
- Category: Stock Indices
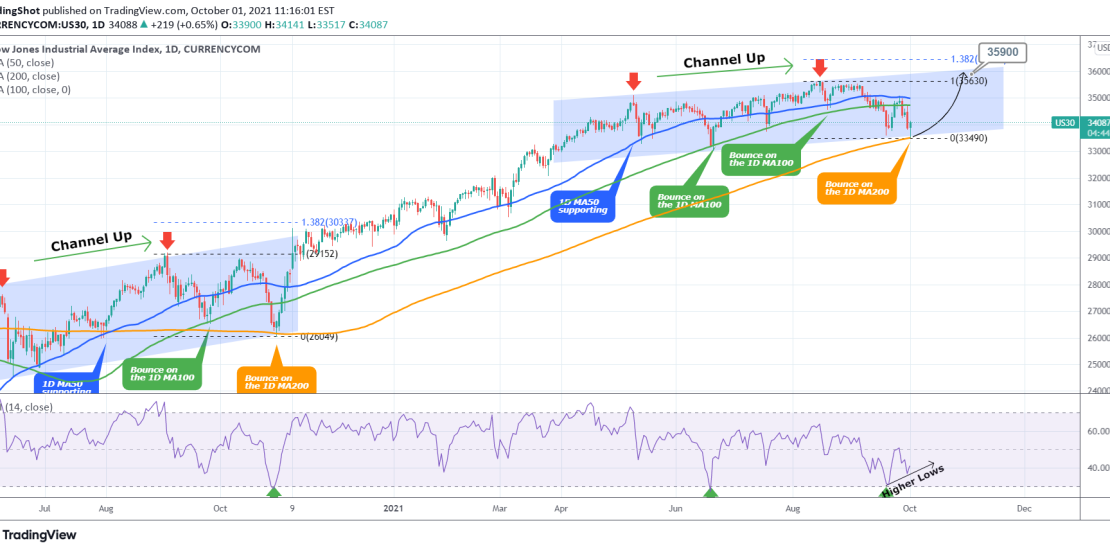
Dow Jones is trading within a Channel Up that reached today its Higher Lows trend-line (bottom). But perhaps the most important development is that in doing so, it hit the 1D MA200 (orange trend-line) for the first time since October 30 2020 (the U.S. elections)! That alone is a strong buy signal itself but consider also the following:
* The RSI bounced on the 30.000 level on September 20 which has marked price bottoms on June 18 2021, October 29 2020 (in the post COVID crash era). Also it has been rising since on Higher Lows.
* The pattern resembles the June – October 2020 Channel Up. The price hit the 1D MA50 (blue trend-line), 1D MA100 and 1D MA200 in the same order and manner.
Based on the Fibonacci extension model, I am setting a target at 35900 by late October – early November.
Tradingview link: