

- August 12, 2021
- Posted by: Tradingshot Articles
- Category: Stock Indices
No Comments
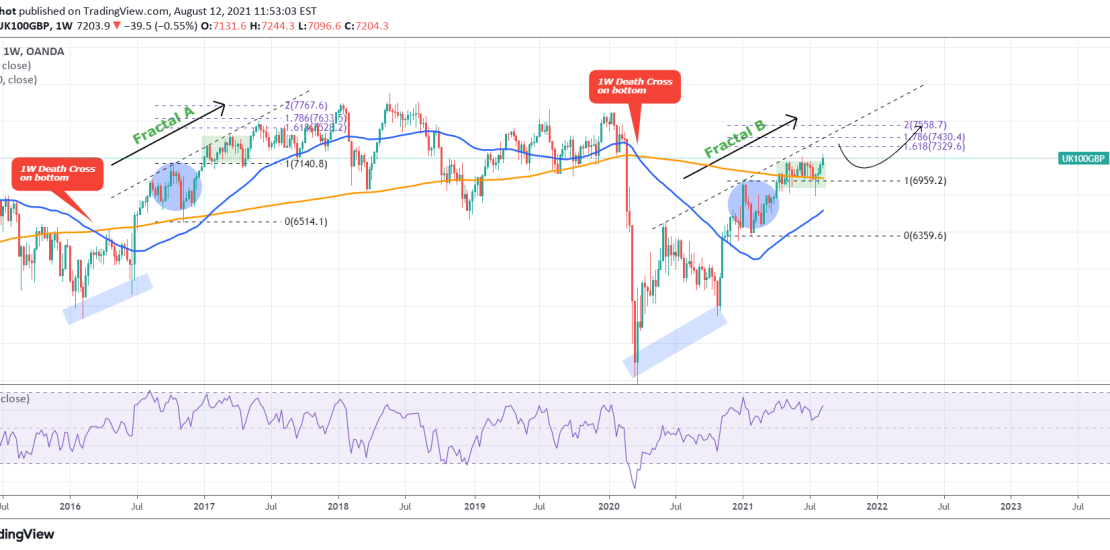
This is a fractal analysis on FTSE from 2017. Not much description is needed here, the chart is quite straightforward. The 2020-2021 (Fractal B) price action so far is similar to the 2016-2017 (Fractal A) sequence. They both started after the market bottomed out on a 1W Death Cross and have been rising with only medium-term pull-backs when the price hit a Higher Highs (dashed) trend-line. In 2017 the index made the next Higher High within the 1.618 – 1.786 Fibonacci extension and topped on the 2.0 Fib mark. If the pattern continues to repeat itself, then FTSE may make a Higher High within 7330-7430, pullback and go for a market top at 7550.
Do you find this comparison reliable?
Most recent FTSE idea:

Tradingview link: