

- September 8, 2021
- Posted by: Tradingshot Articles
- Category: Stock Indices
This idea is a continuation to my analysis posted on August 26:

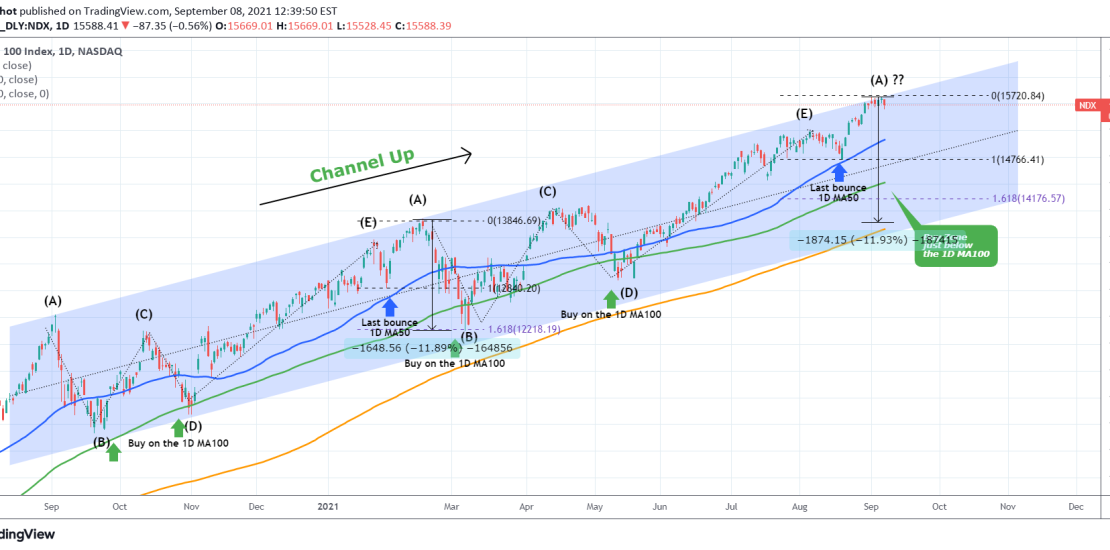
It appears that the leg count and the similarities (so far) of the current price action with the January-February sequence was correct. If the pattern continues to replicate in the same way, then Nasdaq is ahead of a strong correction as this suggests we are currently at the top of the last leg (A).
In February 2021 that resulted in almost a -12% correction that broke below the 1D MA100 (green trend-line) before rebounding. -12% from the top suggests a pull-back value of 13840 while the 1D MA100 is currently at 14417. Perhaps a Fibonacci extension measurement from the last Higher Low (the bounce on the 1D MA50 (blue trend-line)), would be more accurate. In February the correction stopped exactly on the 1.618. Currently the 1.618 Fib ext is at 14176.50.
If this is indeed the start of a similar correction within the long-term Channel Up, is that a reasonable target for you?
Tradingview link:
https://www.tradingview.com/chart/NDX/0TsRLkVL-NASDAQ-initiating-a-strong-correction