
-
BITCOIN 50% of stocks above 1D MA200 = Rally
- December 16, 2022
- Posted by: Tradingshot Articles
- Category: Cryptocurrency
No Comments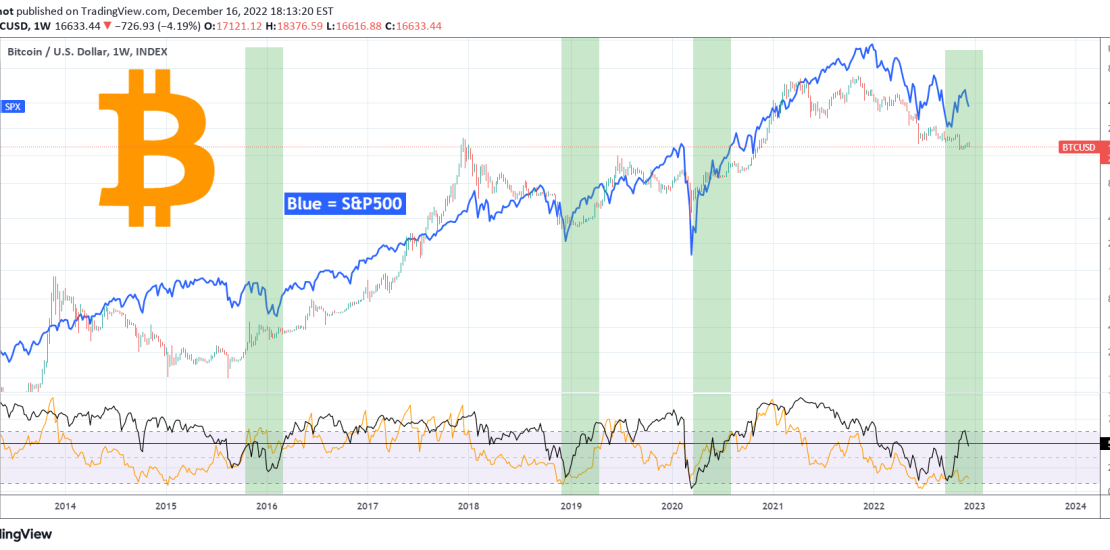
This is Bitcoin (BTCUSD) on the 1W time-frame compared to the S&P500 index (SPX) illustrated by the blue trend-line. The indicator below (black trend-line) shows that historically when 50% of the S&P500 stocks break above their 1D MA200, both Bitcoin and the S&P500 start a rally soon. Initially a few weeks of volatility takes
-
DOGEUSDT This is confirming the new Bull Cycle
- December 15, 2022
- Posted by: Tradingshot Articles
- Category: Cryptocurrency
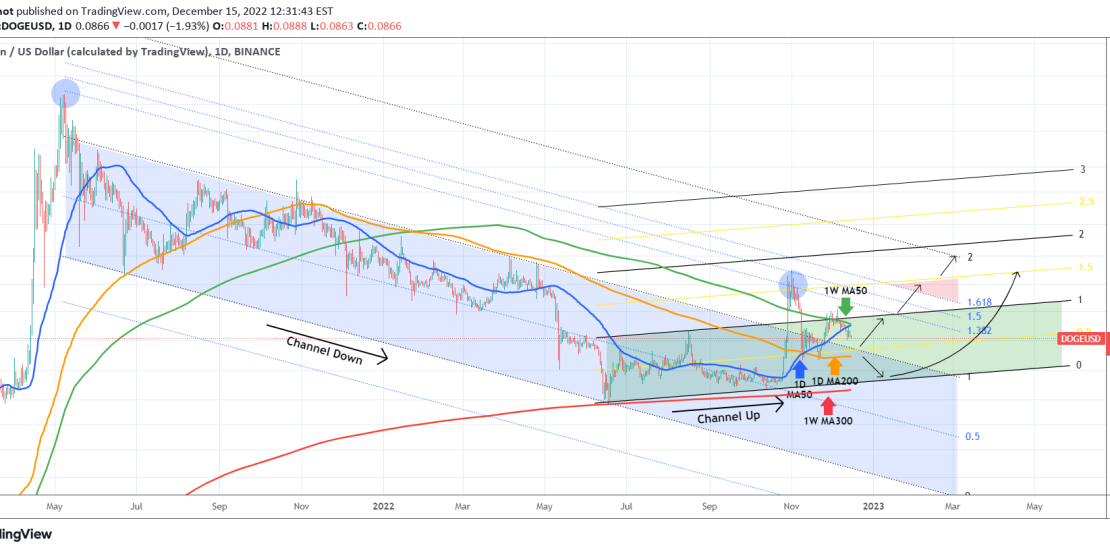
We last looked into Dogecoin (DOGEUSDT) back in late October, analyzing the potential for break-out above the Channel Down that it has been trading in since May 2021 by using the Fibonacci extension levels. As you see, the aggressive Musk-led pump hit the 1.5 Fib extension of the Channel Down, while breaking above the
-
BITCOIN Historical Buy Signal is flashing
- December 12, 2022
- Posted by: Tradingshot Articles
- Category: Cryptocurrency
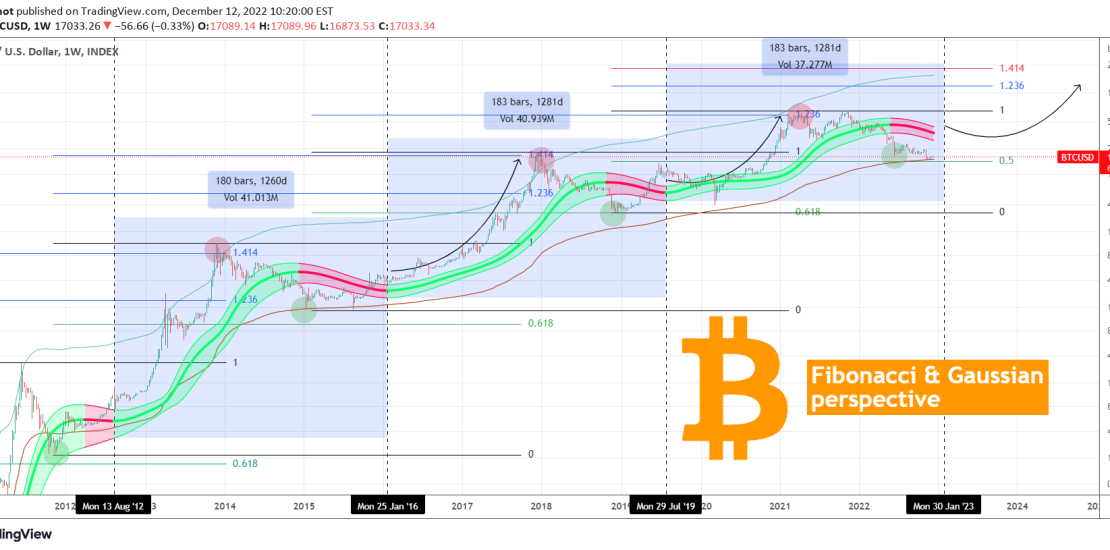
Bitcoin (BTCUSD) remains supported on the 1W MA350 (red trend-line) following the FTX crash. A rare indicator, the Gaussian Channel (GC), remains red but based on previous Cycles, by the time it turns green, Bitcoin already has the first mini rally of the new Bull Cycle. The previous two GC Cycles from the end
-
BITCOIN and S&P500 Has a 10 year Bull phase just started?
- December 11, 2022
- Posted by: Tradingshot Articles
- Category: Cryptocurrency
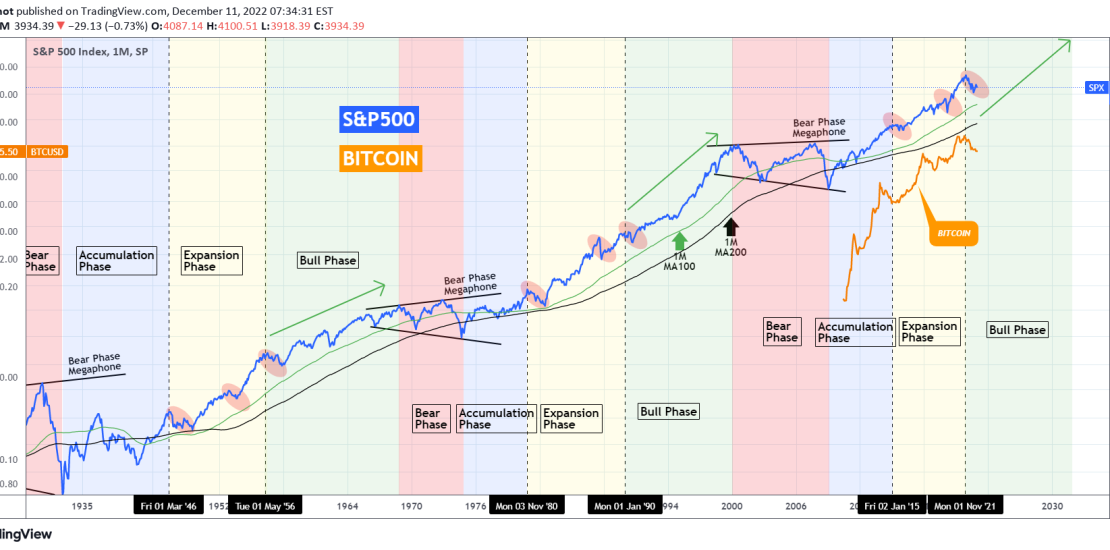
A 1 year correction which is nothing but common throughout Bitcoin’s (BTCUSD) existence, has done its work well in spreading fear and doubt at the market during this inflationary stock crisis in 2022. In times like this what helps the most is to maintain a long-term perspective and look at how history reacted in
-
BITCOIN, Yuan and China bond yields point to rally ahead!
- December 9, 2022
- Posted by: Tradingshot Articles
- Category: Cryptocurrency
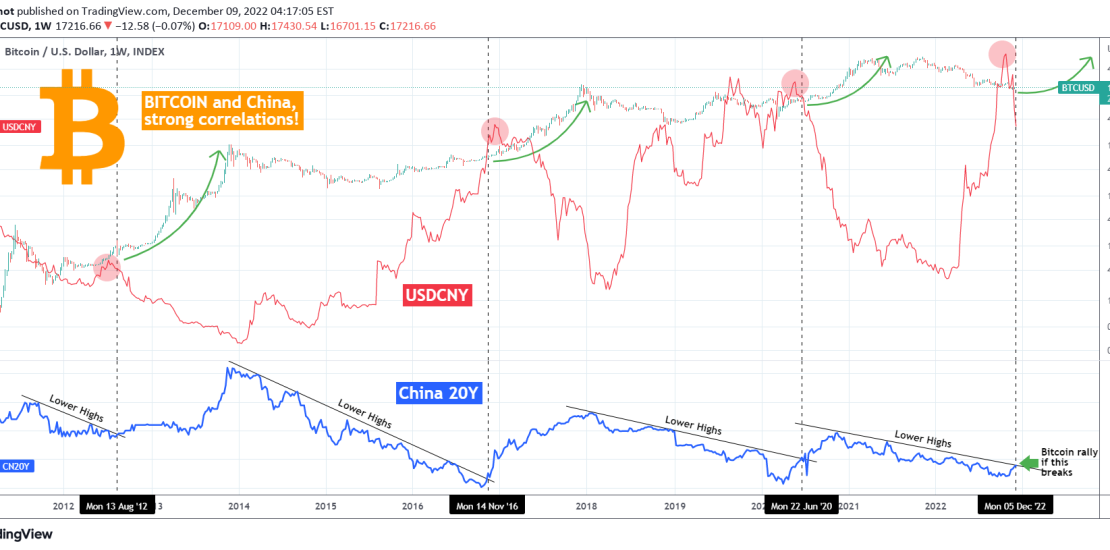
You might be thinking what the Chinese Yuan (USDCNY displayed by the red trend-line) and China’s bond yields (CN20Y displayed by the blue trend-line) have to do with BITCOIN (BTCUSD). This chart comes to show just how strong the correlation is. As you see since 2012, every time the CN20Y broke above its Lower
-
BITCOIN The Golden 51%-49% Ratio is back! Is this the next top?
- December 5, 2022
- Posted by: Tradingshot Articles
- Category: Cryptocurrency
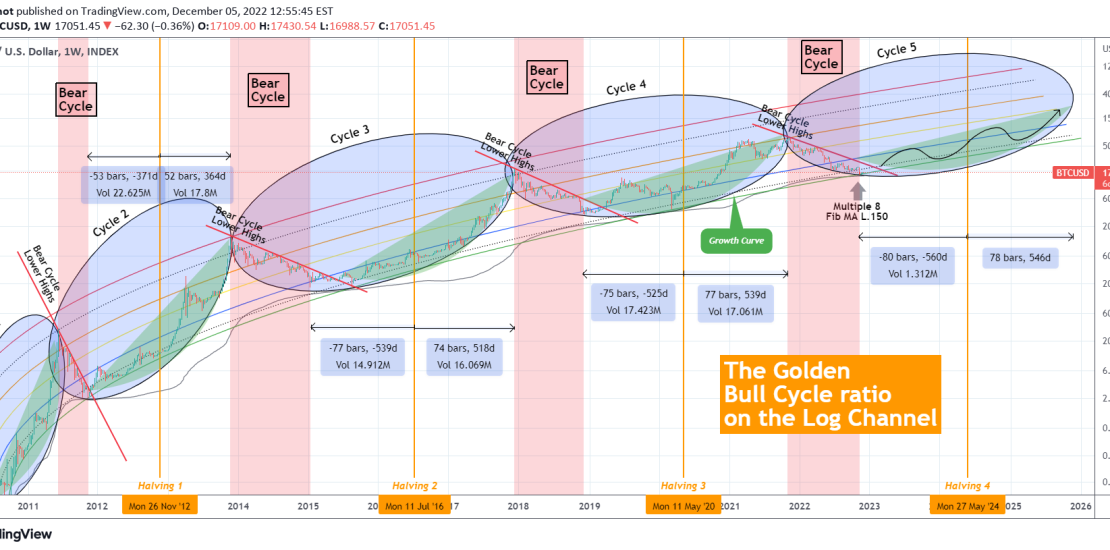
After the interest that the revised version of my Logarithmic Channel model attracted, I thought I’d extend it by adding a few more elements, most notable of which Tradingshot’s very own Golden 51%-49% Ratio! Basically I’ve been asked continuously to make an update on that legendary chart, so here is an extension, though I
-
BITCOIN Long and painful but necessary bottom process!
- December 3, 2022
- Posted by: Tradingshot Articles
- Category: Cryptocurrency
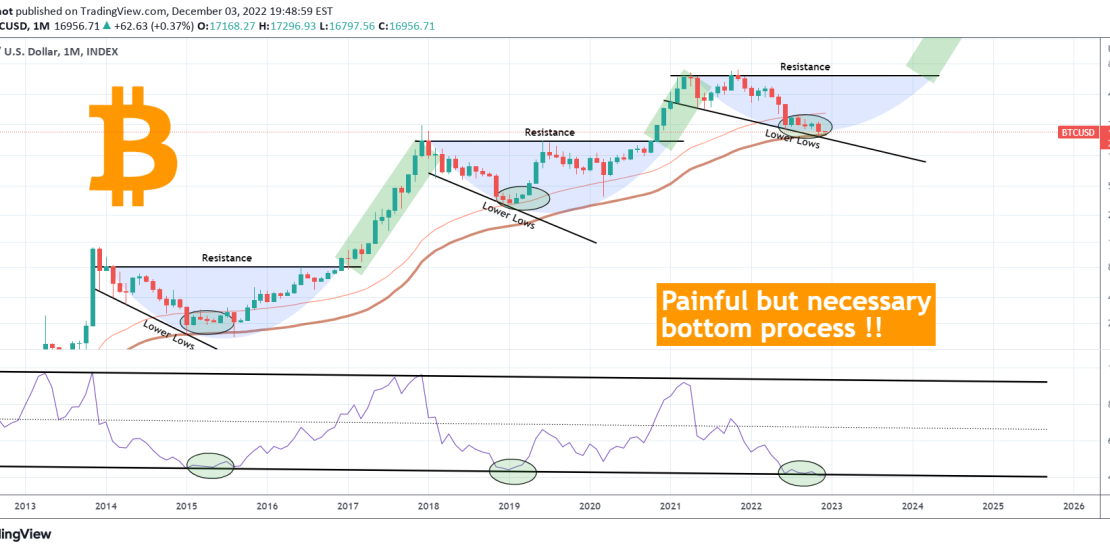
We rarely post Bitcoin (BTCUSD) analyses on the 1M (monthly) time-frame, but this one does justice is showing the complete long-term picture. On a monthly basis, Bitcoin has been forming a bottom since the June Low, within a zone formed by the Fibonacci MA and Multiple 1. At the same time the 1M RSI
-
BITCOIN Log Growth Curve the only pattern that matters right now
- December 2, 2022
- Posted by: Tradingshot Articles
- Category: Cryptocurrency
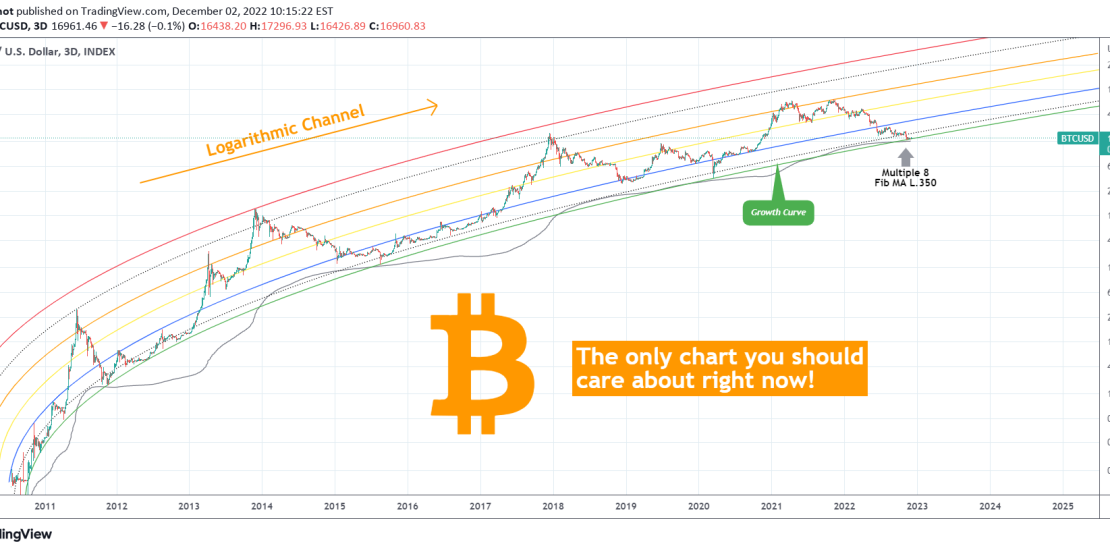
On this chart we seen Bitcoin (BTCUSD) on its historic Logarithmic Channel (LC), the channel that has been trading in since its inception and will put emphasis on its Growth Curve which is the pattern we popularized here since early 2019. See how well the model has been containing the price action going more
-
BITCOIN & the USDT Dominance point to a fast reversal!
- December 1, 2022
- Posted by: Tradingshot Articles
- Category: Cryptocurrency
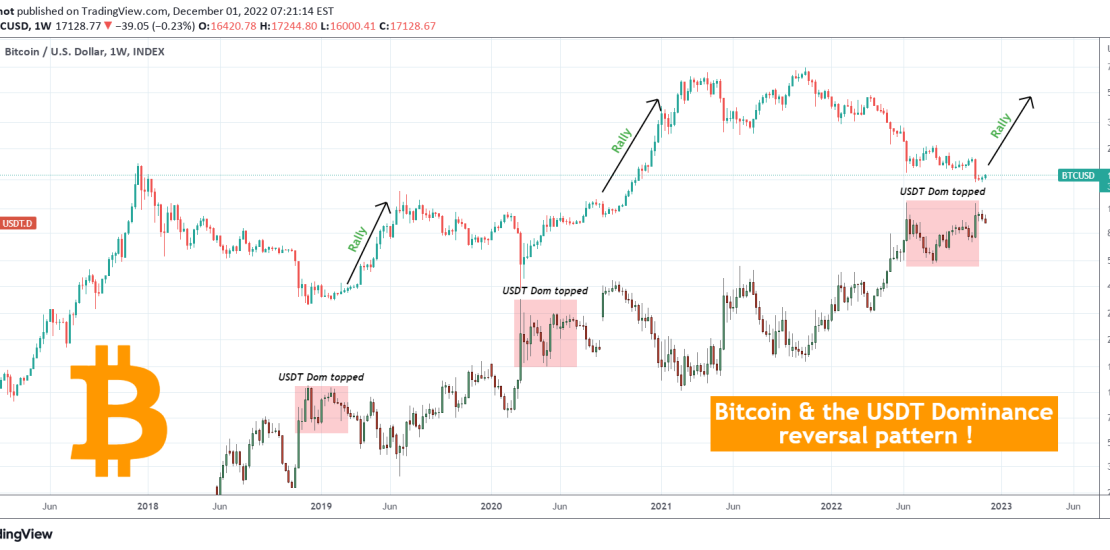
This is Bitcoin (BTCUSD) on the 1W time-frame drawn against the USDT dominance. For better comparison purposes both are displayed in candle bars, BTC being on top, USDT Dom at the bottom. The essence of this comparison is to find a behavioral pattern that can help us estimate which phase of the Cycle BTC
-
RUNEUSD Is preparing a major bullish move
- November 29, 2022
- Posted by: Tradingshot Articles
- Category: Cryptocurrency
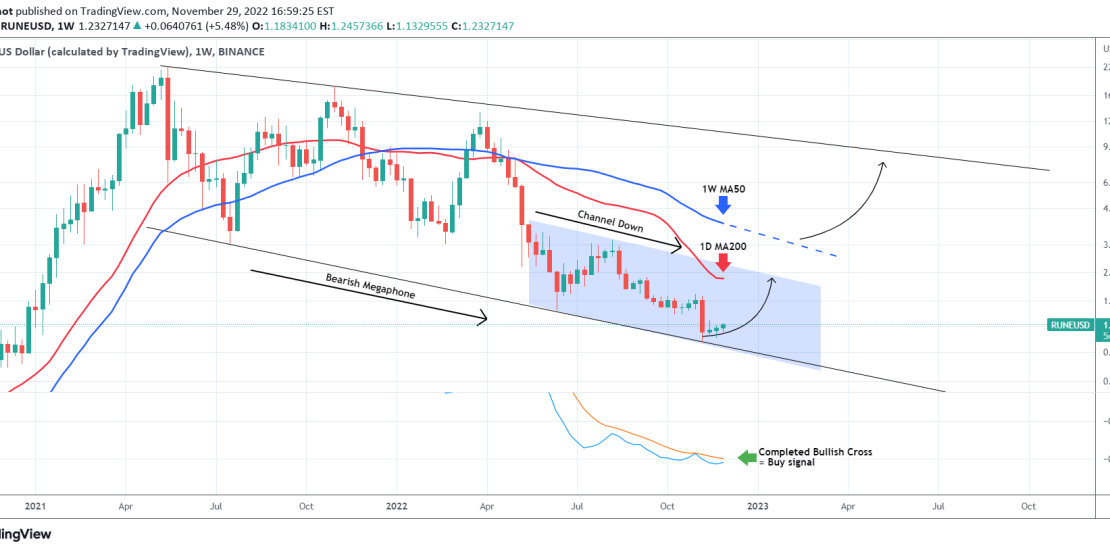
THORChain (RUNEUSD) has been trading within a Channel Down pattern since the June 13 2022 (weekly) low inside a longer-term Bearish Megaphone since the May 17 (weekly) High. The 1W LMACD is close to forming a Bullish Cross. If completed, the short-term target will be the 1D MA200 (red trend-line). A break above the
