- December 9, 2022
- Posted by: Tradingshot Articles
- Category: Cryptocurrency

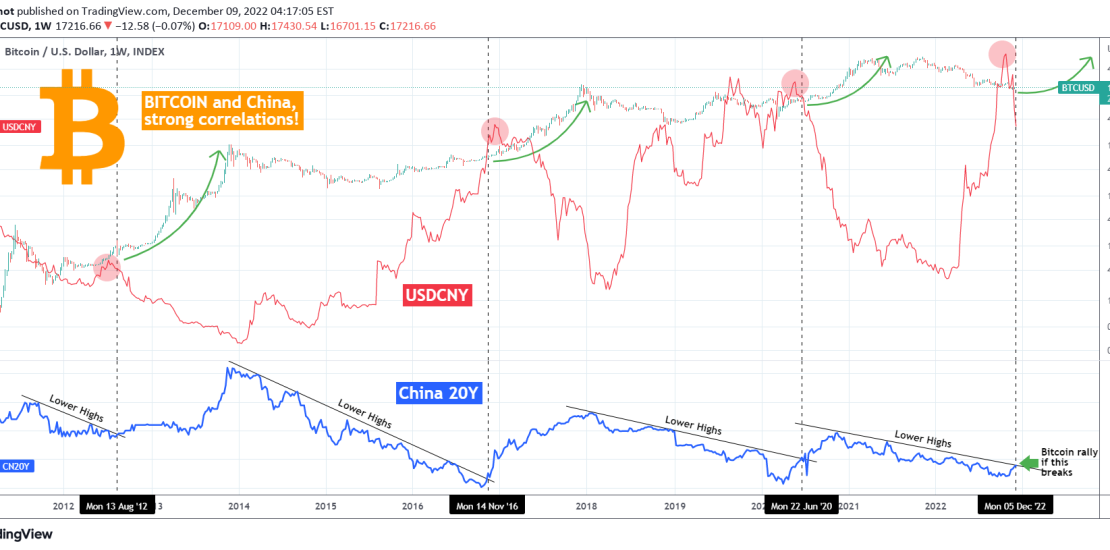
You might be thinking what the Chinese Yuan (USDCNY displayed by the red trend-line) and China’s bond yields (CN20Y displayed by the blue trend-line) have to do with BITCOIN (BTCUSD). This chart comes to show just how strong the correlation is.
As you see since 2012, every time the CN20Y broke above its Lower Highs trend-line, Bitcoin started its Bull Cycle rally. This makes the two assets strongly positively correlated. In addition, when that happened, it always coincided with the USDCNY starting a major fall (red circle on the chart, making the two assets mostly negatively correlated. In fact Bitcoin has had its Bull Cycles in major long-term USDCNY falls and its Bear Cycle in major USDCNY rises.
Right now the CN20Y is testing the 2021/2022 Lower Highs trend-line again. Do you think a break above it would start Bitcoin’s new major Bull rally? Feel free to let me know in the comments section below!
Tradingview link:

