- December 1, 2022
- Posted by: Tradingshot Articles
- Category: Cryptocurrency

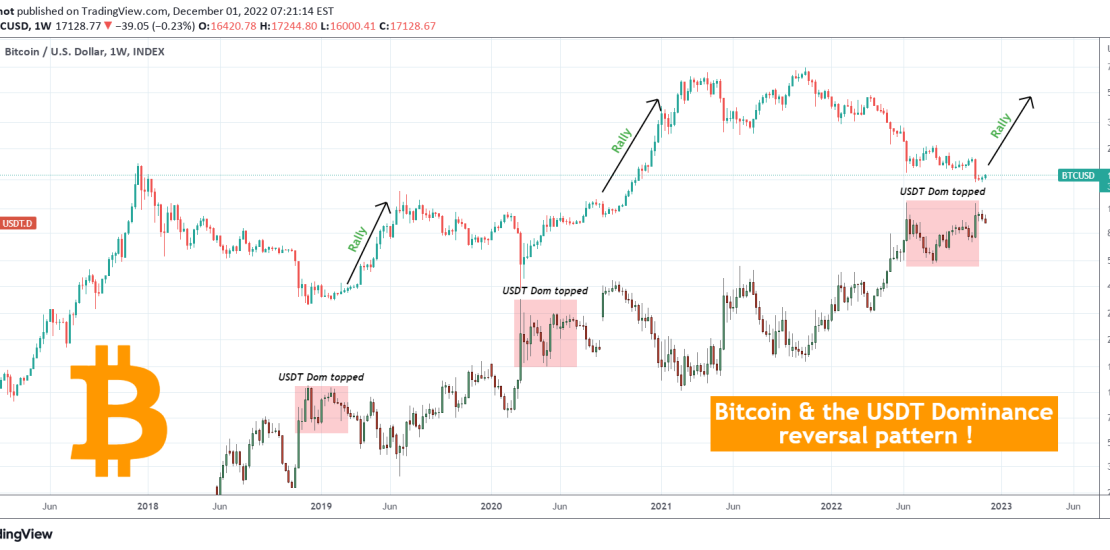
This is Bitcoin (BTCUSD) on the 1W time-frame drawn against the USDT dominance. For better comparison purposes both are displayed in candle bars, BTC being on top, USDT Dom at the bottom.
The essence of this comparison is to find a behavioral pattern that can help us estimate which phase of the Cycle BTC could be at. As you see, the USDT Dom is printing a pattern, technical top formation that has been previously associated with market bottoms on Bitcoin. In the past two weeks, the USDT Dom has started to pull-back and that very same sequence in July 2020 and February 2019 extended the drops, which was translated into an instant rally on Bitcoin. Even in the case of the August 31 2020 week and the injection that sent the USDT Dom (much) higher following the initial pull-back, the price quickly get back to its harmonized levels and fell back massively.
BTC has already started to react favorably to this 2-week USDT Dom pull-back. Do you think it can keep up this momentum and if this is indeed a USDT D. top are we ahead of a strong rally? Feel free to let me know in the comments section below!
Tradingview link:

