

- December 16, 2022
- Posted by: Tradingshot Articles
- Category: Cryptocurrency
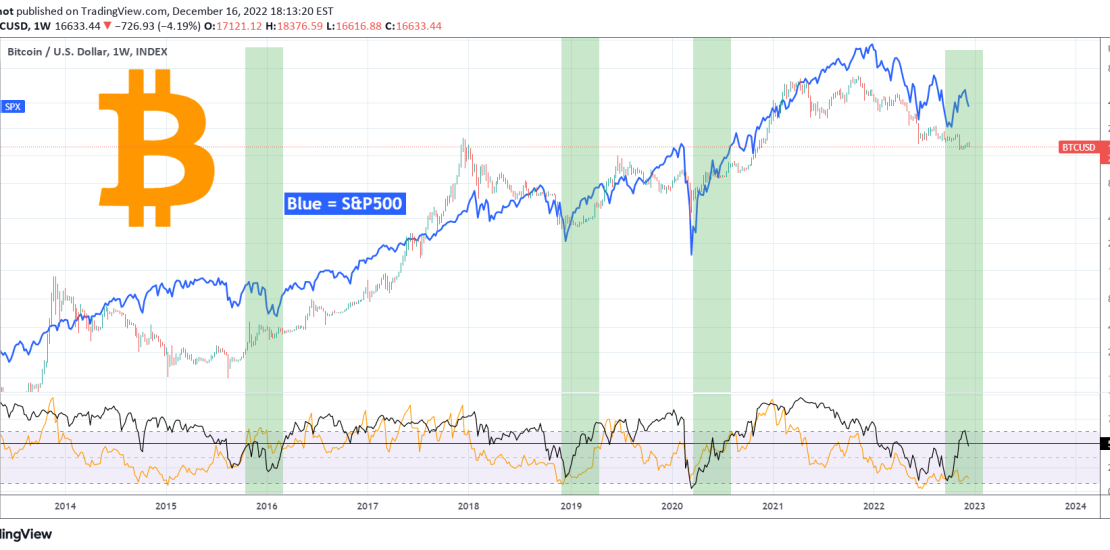
This is Bitcoin (BTCUSD) on the 1W time-frame compared to the S&P500 index (SPX) illustrated by the blue trend-line. The indicator below (black trend-line) shows that historically when 50% of the S&P500 stocks break above their 1D MA200, both Bitcoin and the S&P500 start a rally soon.
Initially a few weeks of volatility takes place but the process already kicks in. Bitcoin’s RSI is displayed in orange to give a better perspective of where we could be historically compared to prior bottoms. As you see, it tends to lag behind the stocks’ indicator when it breaks above 50% .
Do you think the pattern will be repeated again? Feel free to let me know in the comments section below!
Tradingview link:
https://www.tradingview.com/chart/BTCUSD/Ik805fbq-BITCOIN-50-of-stocks-above-1D-MA200-Rally