- December 2, 2022
- Posted by: Tradingshot Articles
- Category: Cryptocurrency

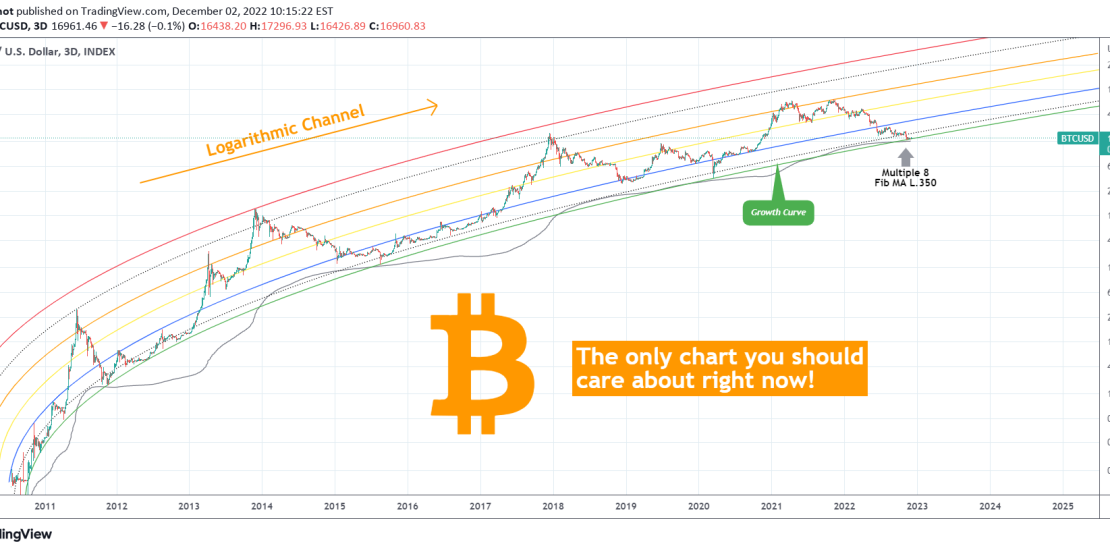
On this chart we seen Bitcoin (BTCUSD) on its historic Logarithmic Channel (LC), the channel that has been trading in since its inception and will put emphasis on its Growth Curve which is the pattern we popularized here since early 2019.
See how well the model has been containing the price action going more than 3 years back:
Back to today now. As you see on this chart, which as we mention is the only chart you should care about right now, Bitcoin following the FTX crash hit the bottom of its Logarithmic Channel (LG), displayed by the green line, which historically has proven to be the ultimate buy level, with strong rallies following shortly after.
Since then it has been trading on the green line, which we call the Growth Curve (GC), showing the first signs of a new, and most likely the final, accumulation phase. As long as it stays within the GC and the dotted line above, BTC will continue to accumulate.
Above that, the first historic Resistance in an upcoming Bull Cycle is the Blue line, which kept the price at bay for most of the 2012 and 2015/16 Cycles, before the parabolic rally that capped the Bull Cycle.
The yellow line is a typical pivot line during both Bull and Bear Cycles, as you see it held the first waves of the 2021/22 Bear Cycle before eventually failing.
The orange line, is the level where investors typically look to sell and exit the Bull Cycle, while the zone formed by the upper dotted line and the red one has historically been an absolute (extremely overbought) belt.
Right now the price is on the absolute bottom of this model that has never failed while having the Multiple 8 (grey trend-line) just below it, which also has never been broken and marked the bottoms of March 2020, August 2015 and November 2011.
Are you a buyer or a seller based on this? Feel free to let me know in the comments section below!
Tradingview link:


