

-
Bitcoin and the question we should be asking ourselves
- February 23, 2019
- Posted by: Tradingshot Articles
- Category: Cryptocurrency
No Comments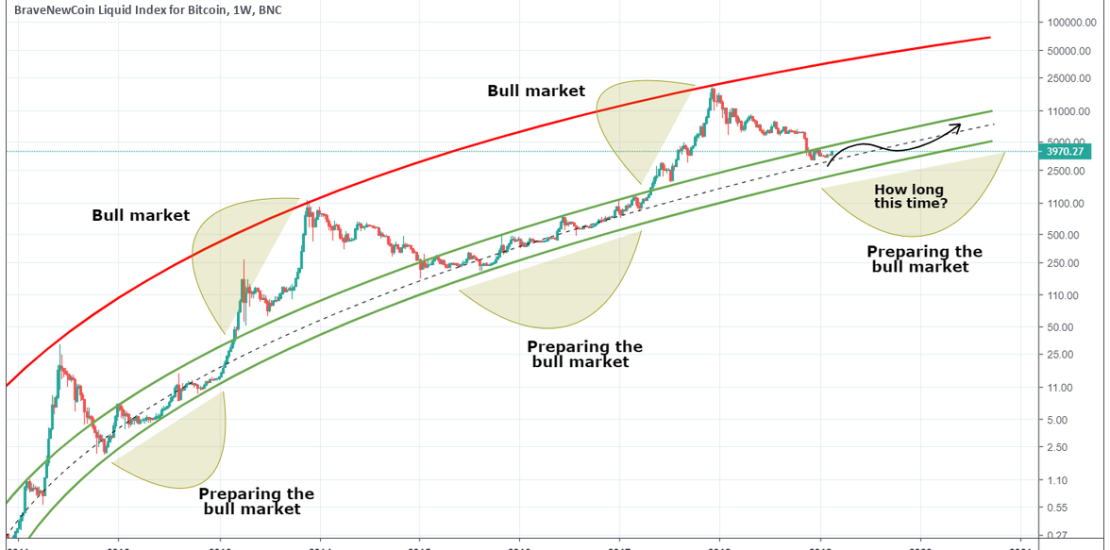
This is the standard BLX chart used to track the candle patterns of Bitcoin from its early stages. The pattern is parabolic and that has been discussed more than enough here. What I want to emphasize most with this analysis is the support provided by the Green Zone. As soon as the price enters this
-
Is 180 next for Litecoin?
- February 21, 2019
- Posted by: Tradingshot Articles
- Category: Cryptocurrency
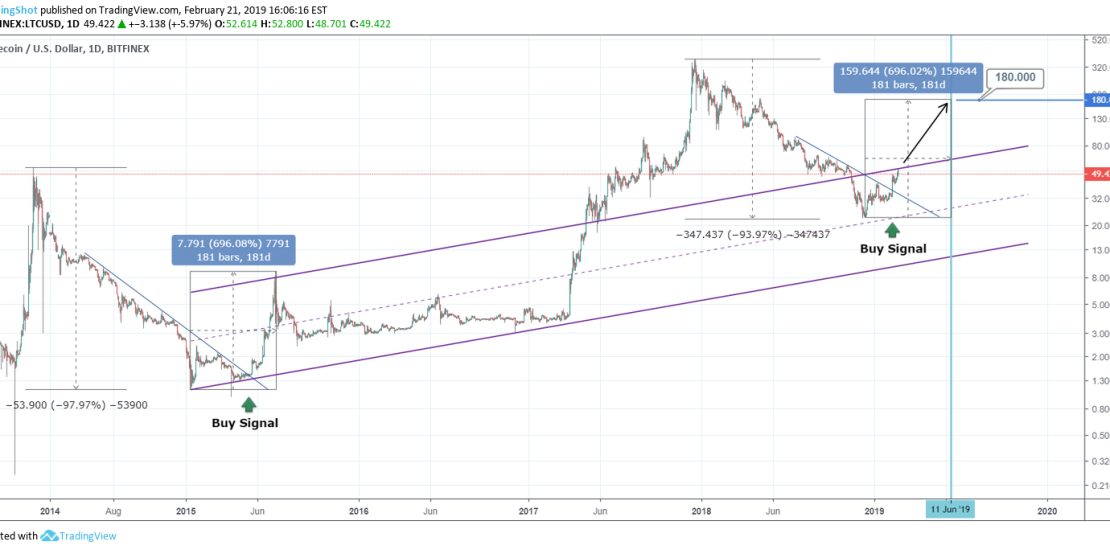
I feel that the chart is clear enough to explain the idea behind it. Litecoin’s two bear markets (2014-2015 and 2018-2019) share a similar pattern behavior. A Buy Signal occurred in May 2015 after the bottom was made in January and a support was formed. The price broke a Lower High trend line and rallied
-
Can Bitcoin hit 9000 this year? Gold shows the way.
- February 16, 2019
- Posted by: Tradingshot Articles
- Category: Cryptocurrency
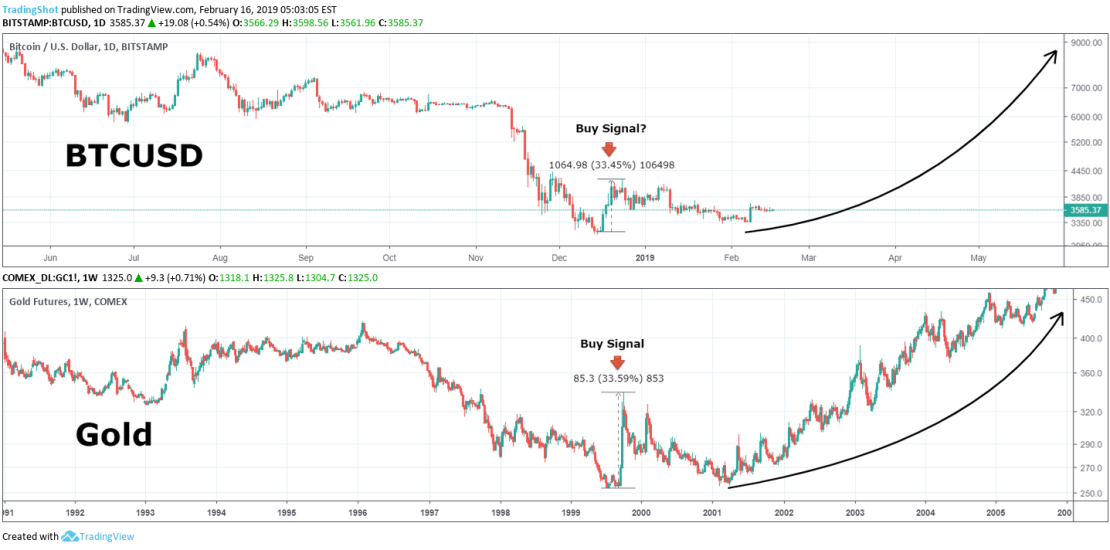
This analysis brings to center stage Bitcoin and the asset mostly linked with, Gold. On this chart, Bitcoin (the digital Gold) shows a quite similar behavioral pattern with Gold’s bottom period of the 80s/ 90s bear cycle. What stands out is this identical +33.50% bounce on Gold and the subsequent Double Top followed by a
-
Bitcoin targets 11000
- February 14, 2019
- Posted by: Tradingshot Articles
- Category: Cryptocurrency
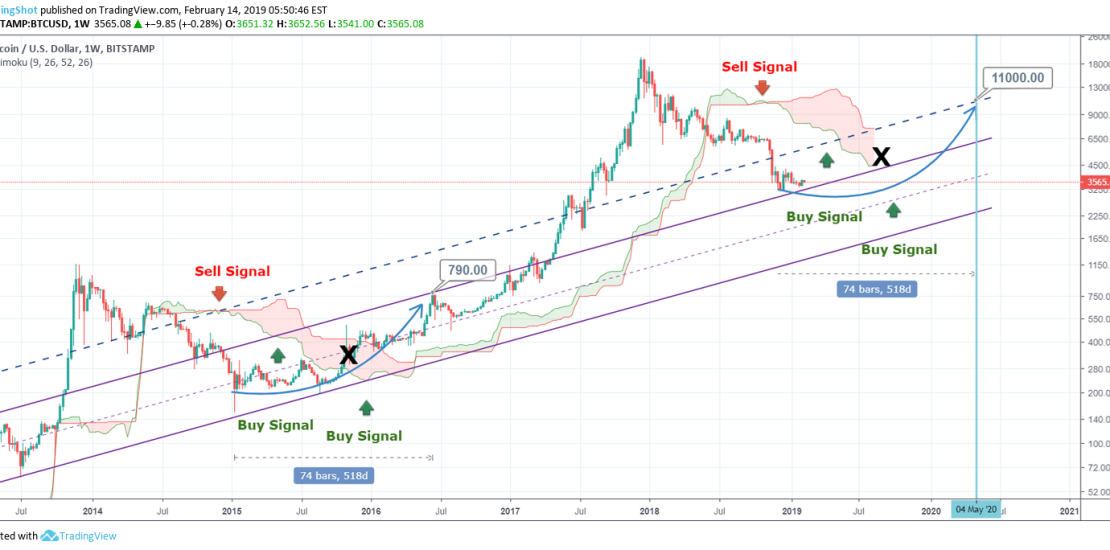
This pattern shows that BTCUSD is trading on its new long term support zone. Using the Ichimoku Cloud as a prime leading indicator, we can identify key trend signals and many similarities between Bitcoin’s last two bear cycles (2014/15 and 2018/19). First of all the cloud’s squeeze (October – December 2014 and September – November
-
ETHBTC Time for Ethereum to cool off?
- January 27, 0202
- Posted by: Tradingshot Articles
- Category: Cryptocurrency
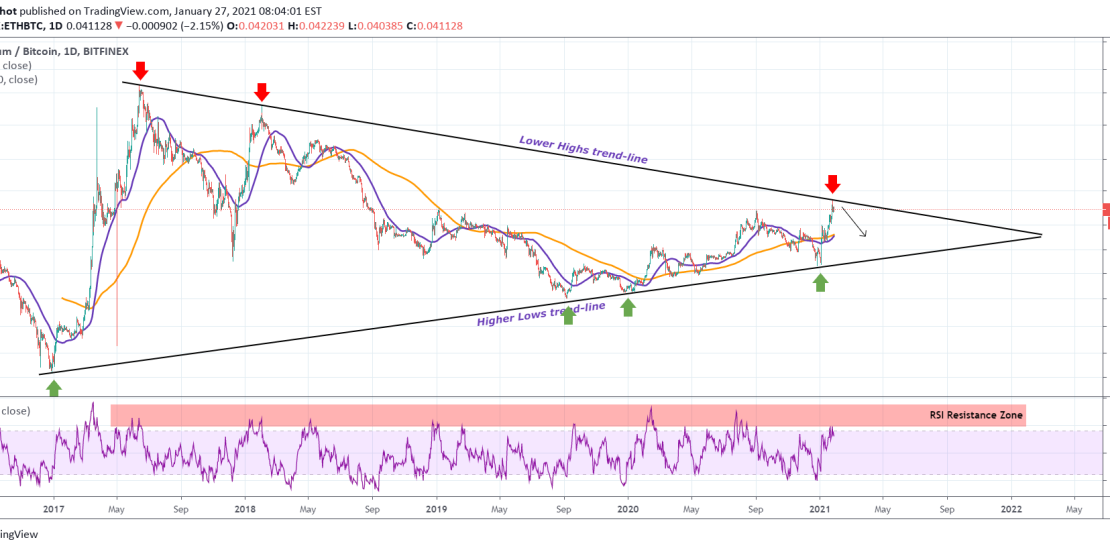
The greater pattern of ETHBTC has been a Triangle since mid 2017. Yesterday the pair made contract with the pattern’s Lower Highs trend-line for the first time since February 03, 2018! Also the 1D RSI is entering its 4 year Resistance Zone. Every time ETHBTC hit those levels, it pulled back to at least