

- December 11, 2022
- Posted by: Tradingshot Articles
- Category: Cryptocurrency
A 1 year correction which is nothing but common throughout Bitcoin’s (BTCUSD) existence, has done its work well in spreading fear and doubt at the market during this inflationary stock crisis in 2022. In times like this what helps the most is to maintain a long-term perspective and look at how history reacted in similar situations.
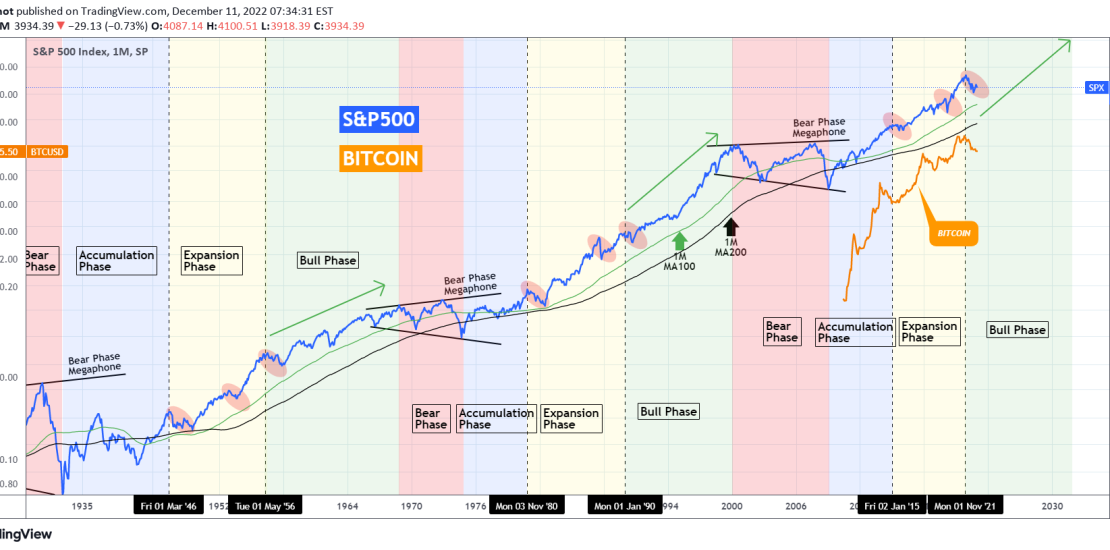
We thought that nothing can help us get a better grasp at the situation than look into how Bitcoin compares to the major stock index the S&P500 (SPX). On this 1M time-frame, Bitcoin is displayed by the orange trend-line while the S&P500 by the blue. We are looking into the S&P500’s price action since the Great Depression. As you see the index repeats through history four major phases:
* The Bear Phase (red), where the index gets into a Megaphone pattern and has two major correction sequences. It breaks initially below the 1M MA100 (green trend-line) and then below the 1M MA200 (black trend-line).
* The Accumulation Phase (blue), where the index starts recovering from the Bear Phase and breaks above both the 1M MA100 and MA200, turning sideways. This is technically the most efficient/ earliest available level to enter the market.
* The Expansion Phase (yellow), where the index established trading above the 1M MA100/200 (never breaks them until the next Bear Phase) and makes the first multi-year rise. This Phase is marked by three “smaller” correction periods (red ellipses).
* The Bull Phase (green), where the index recovers from the last small correction and rises aggressively to form the top before the new Bear Phase. It tends to last around 10 years.
This year’s correction (2022) is the third one of the Expansion Phase and as the price remains above the 1M MA100, it is more likely that with the correction already completed, S&P500 has entered its new Bull Phase.
The chart clearly shows that Bitcoin’s 12 year period of immense growth has only been during the S&P500’s Accumulation and Expansion Phases. This suggests that we may haven’t seen yet it’s strongest growth to come during the stock market’s new Bull Phase! The correlation of Bitcoin’s tops and bottoms to those of the S&P500 is more than obvious.
Most market participants say that this time is different due to the soaring inflation and aggressive rate hikes. But hasn’t this also been the narrative in the late 70s? Still the market found the mechanisms to grow in the Expansion Phase that followed and the new technologies (internet etc) to inflate it to immense highs in the 90s until the eventual crashes of the 00s. It may seem like a different reason each time but the behavior is always cyclical with repeating patterns and phases, the narrative in the past 100 years can be whatever the news decide it to be. But the market will continue printing and printing the same patterns as human behavior stays the same.
So what do you think, are we about to witness the growth of a lifetime on both Bitcoin and stocks in the next 10 years? Feel free to let me know in the comments section below!
Tradingview link: