

-
WTI OIL turning Parabolic Towards $82.50.
- October 5, 2021
- Posted by: Tradingshot Articles
- Category: Commodities
No Comments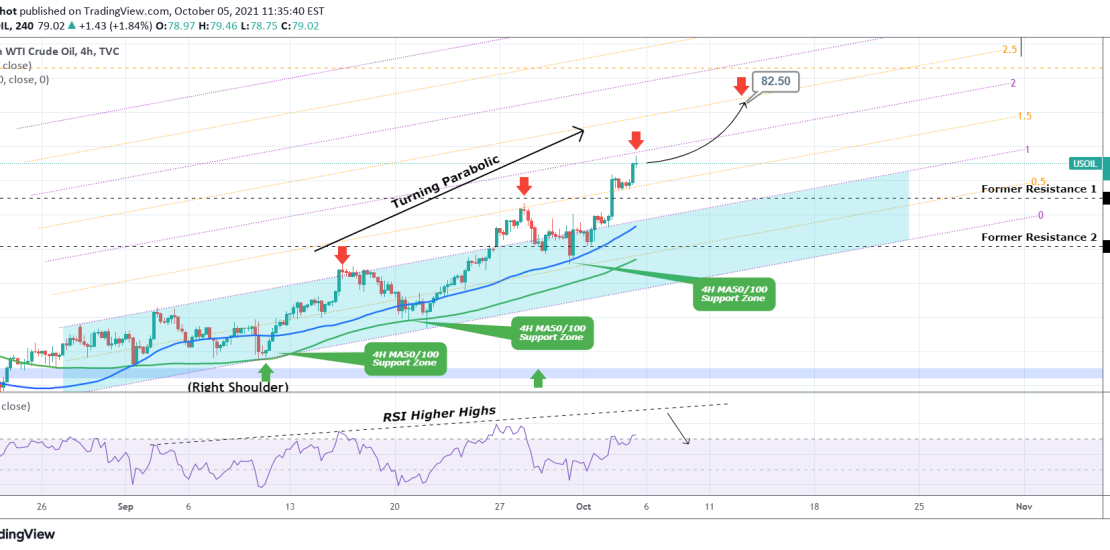
Since WTI Oil broke the former two Resistance levels (74.15 and 77.00), the price turned parabolic outside the Channel Up that dominated most of the price action in September. There seems to be a Buy/ Support Zone consisting of the 4H MA50 (blue trend-line) and the 4H MA100 (green trend-line) and a Resistance Zone
-
XAUUSD targeting $1800
- September 30, 2021
- Posted by: Tradingshot Articles
- Category: Commodities
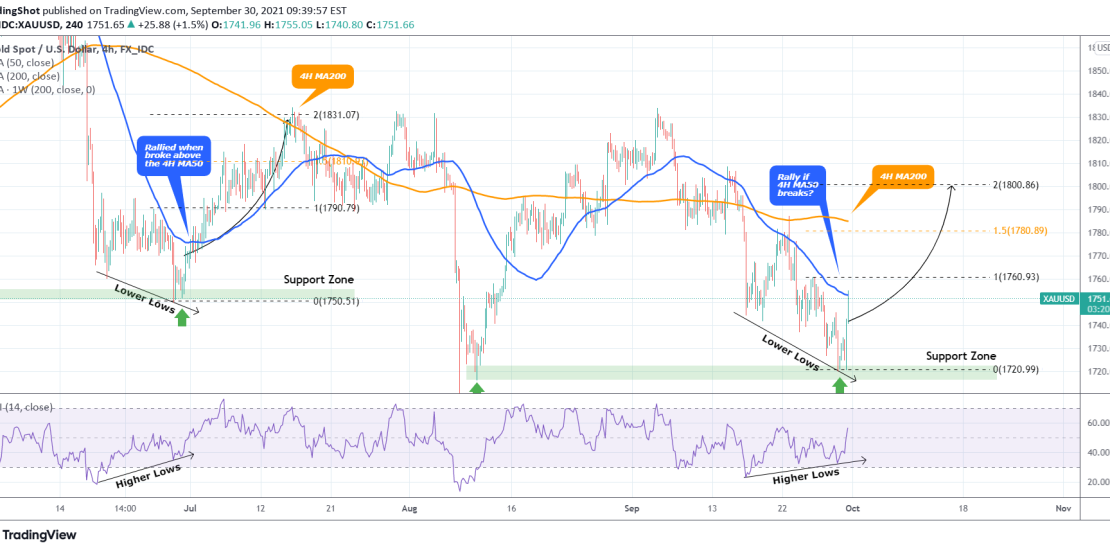
The price is now testing the 4H MA50 (blue trend-line) for the first time in a week. As mentioned on my most recent post, a 1D candle closing above 1747, would mean the start of a rebound. As you see the current fractal is trading on an identical pattern with the June 18-30 sequence.
-
WTI OIL Inverse Head and Shoulders
- September 17, 2021
- Posted by: Tradingshot Articles
- Category: Commodities
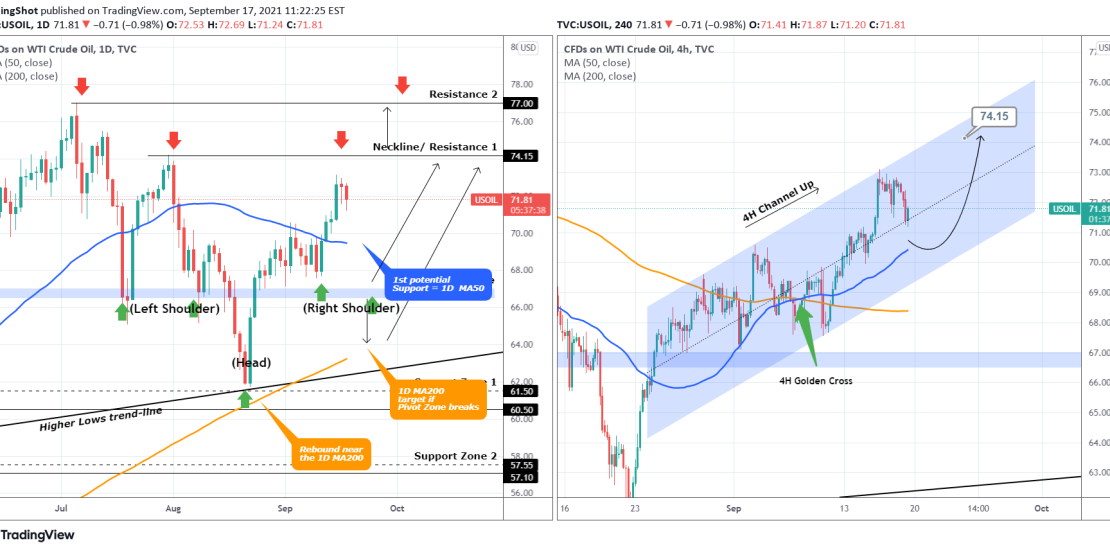
Last time I made a post on WTI Oil the price was still struggling to get past both a very strong Lower Highs trend-line and the 1D MA50 (blue trend-line on the left chart): Well the price managed to break and close above both and rallied. The rejection though near the 74.15 Resistance has
-
WTI OIL analysis on the 1D and 4H time-frames
- September 7, 2021
- Posted by: Tradingshot Articles
- Category: Commodities
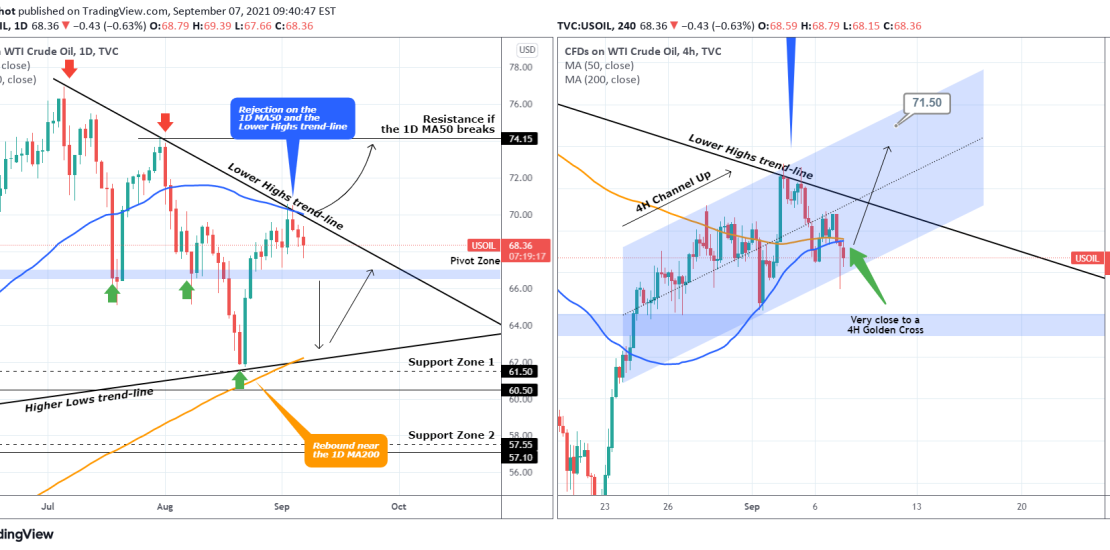
Last time I analyzed WTI Oil on August 24, I made it clear that it was trading within a long-term Triangle and until it broke, its price action would be sideways: I stressed out the importance of the 1D MA50 (blue trend-line) and the Lower Highs trend-line of that Triangle. Well as you see
-
XAUUSD broke above the 1W MA50 for the 1st time since June!
- September 3, 2021
- Posted by: Tradingshot Articles
- Category: Commodities
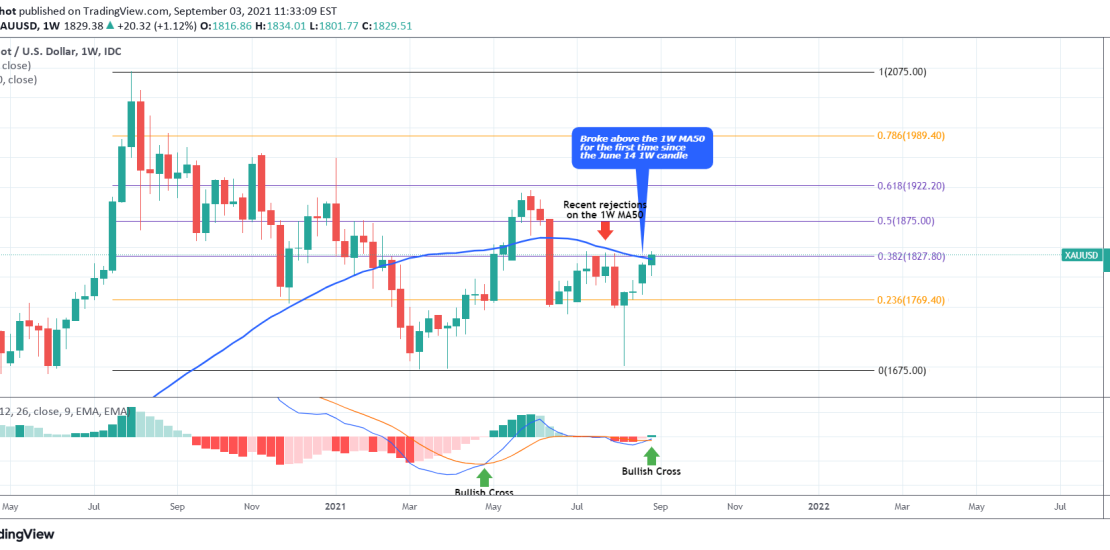
My most recent Gold signal was on the short-term time-frame of 4H: This time we have a significant technical development on long-term and I’ve moved us to the 1W time-frame where XAUUSD just broke above the 1W MA50 (blue trend-line) for the first time since the June 14 weekly candle. Closing the week above
-
XAUUSD Golden Cross formed on 4H
- August 31, 2021
- Posted by: Tradingshot Articles
- Category: Commodities
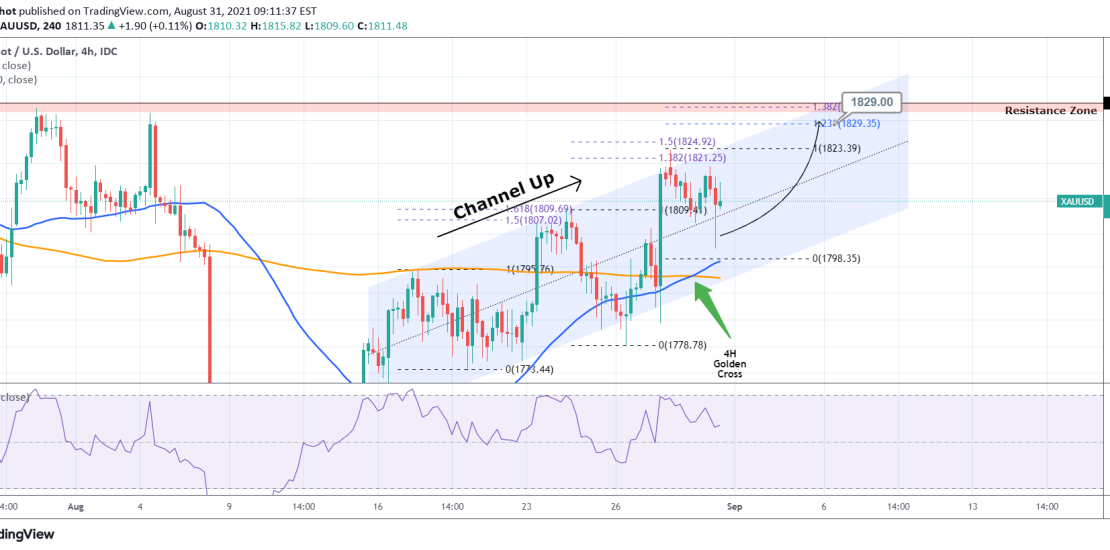
Pattern: Channel Up on 4H. Signal: Buy as the price rebounded near the 4H MA50 (blue trend-line) and even though there is still room within the Channel for one last low, the 4H Golden Cross that was formed may bring higher prices without it. Target: 1829 (just below the 1.236 Fibonacci retracement level and
-
WTI OIL had the biggest weekly rise since May 31 2020!
- August 31, 2021
- Posted by: Tradingshot Articles
- Category: Commodities
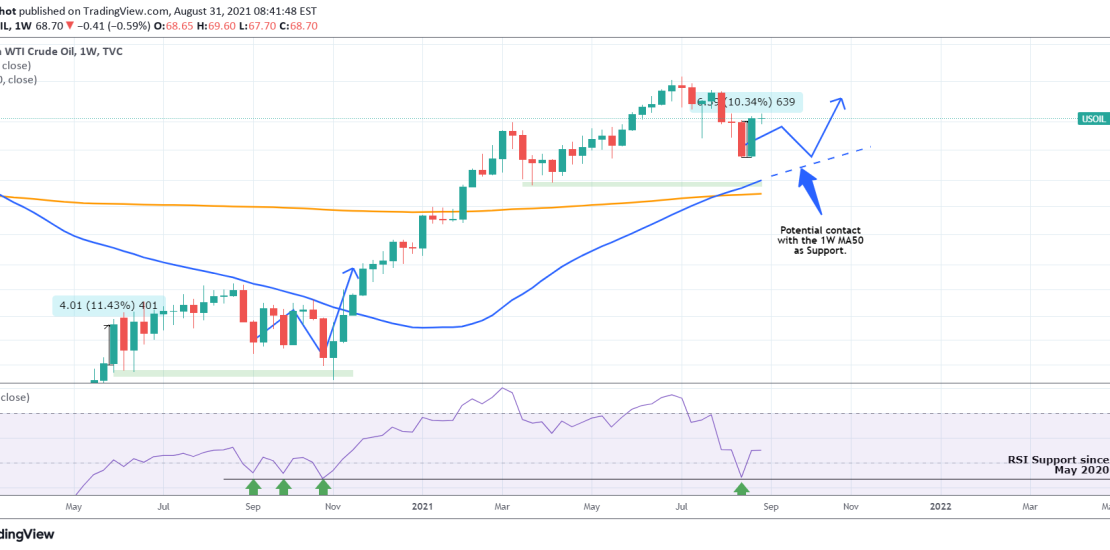
WTI Crude Oil posted last week the strongest 1W candle (+10.30%) since May 31 2020 (+11.44%). What can this possibly mean for future prices? Alone nothing. But as you see, last week’s bounce came after a 1W RSI touch on the 43.50 Support which has been holding since May 2020 as well. That makes
-
WTI OIL aiming at the 1D MA50
- August 24, 2021
- Posted by: Tradingshot Articles
- Category: Commodities

Pattern: Triangle on 1D. Signal: Buy as the price (a) made a strong rebound on the Higher Lows trend-line, (b) near the 1D MA200 (orange trend-line) and (c) broke above the Pivot Zone. Target: The 1D MA50 (blue trend-line). Tradingview link: https://www.tradingview.com/chart/USOIL/X7DQLRmq-WTI-OIL-aiming-at-the-1D-MA50
-
XAUUSD They symmetrical harmony of Fibonacci levels
- August 24, 2021
- Posted by: Tradingshot Articles
- Category: Commodities
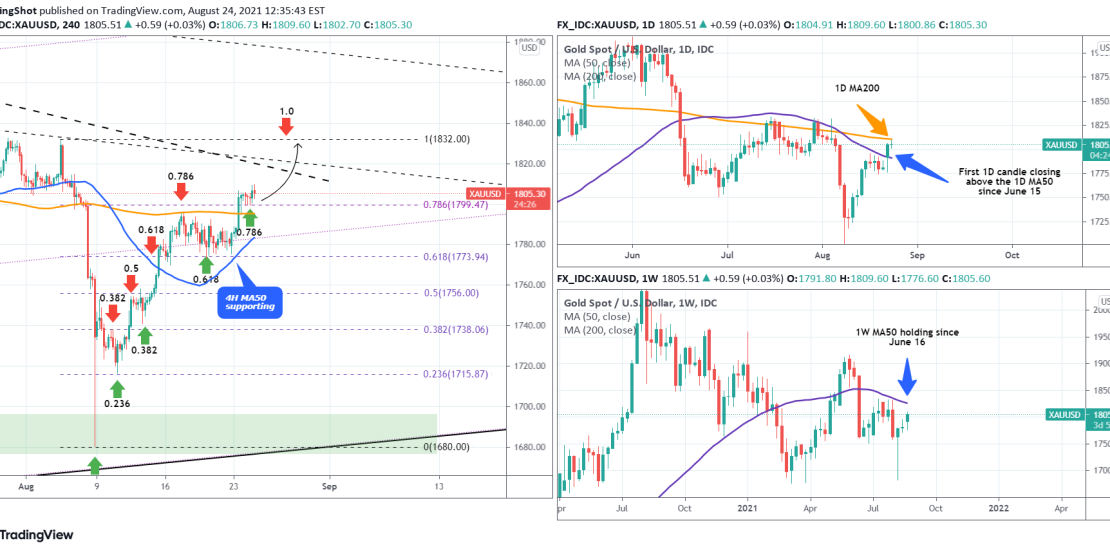
In my most recent Gold idea I introduced the importance of the Fibonacci retracement levels as targets following the August 08 flash crash of the Nonfarm Payrolls: As you see since then, the Fibs have acted very well as Resistance levels which on the following pull-backs acted as Supports. As the 0.786 Fib is
-
XAUUSD Bullish divergence and Inverse H&S lead to break-out
- August 11, 2021
- Posted by: Tradingshot Articles
- Category: Commodities
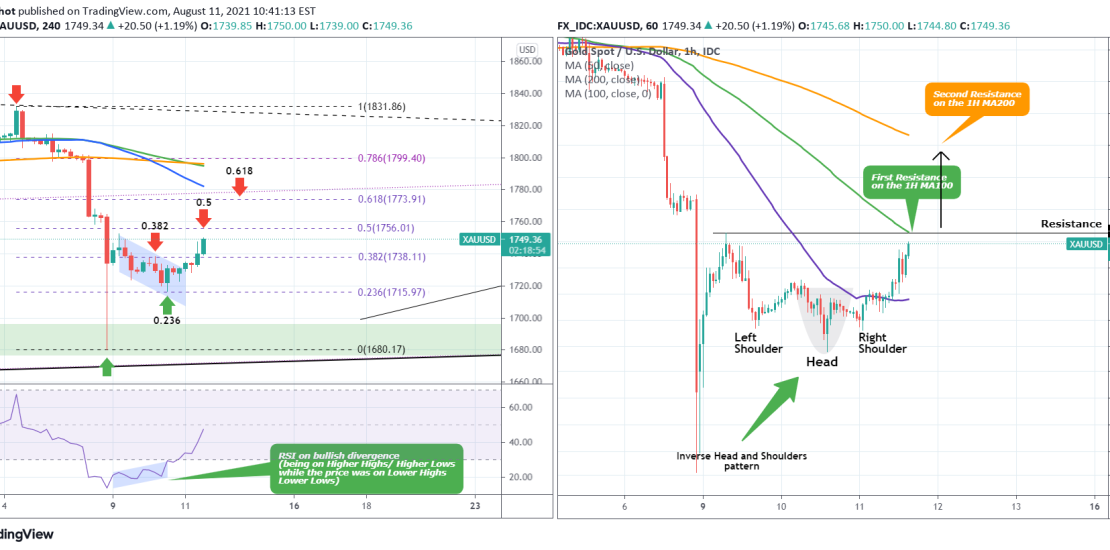
This is a short-term update to my recent long-term idea: As you see on the left chart, Gold broke above the Channel Down and the early signal to this break-out was the 4H RSI which was you see was on a Bullish Divergence as while the price was in a Channel Down, the RSI