

- August 11, 2021
- Posted by: Tradingshot Articles
- Category: Commodities
This is a short-term update to my recent long-term idea:

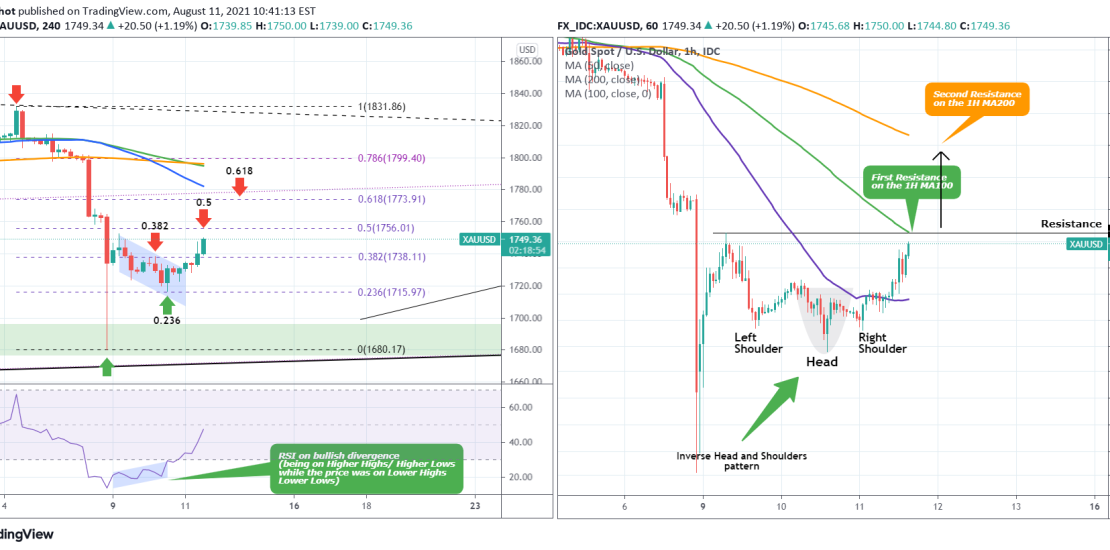
As you see on the left chart, Gold broke above the Channel Down and the early signal to this break-out was the 4H RSI which was you see was on a Bullish Divergence as while the price was in a Channel Down, the RSI was in a Channel Up. So far the Fibonacci retracement levels from the August 04 Top to the August 08 bottom play an important role as the 0.5 and 0.382 have so far acted as Resistance levels, while the 0.236 Fib as a Support. Naturally if the 0.5 Fib level break, the next Resistance could be seen on the 0.618 retracement level, where the 4H MA50 (blue trend-line) is headed to.
On the right chart (which is on the 1H time-frame) we see the other short-term pattern that caused XAUUSD to find Support. As you see it is on an Inverse Head and Shoulders (IH&S) which is a pattern typically seen on bullish reversals. The Resistance is at 1,752.60, which is exactly where the 1H MA200 (green trend-line) is. If it breaks, then the short-term price action gains a Support level on the 1H MA50 (blue trend-line) and technically sets eyes on the 1H MA200 (orange trend-line) ehich is currently at 1783 but at the time of a potential contact may be closer to 1775, i.e. roughly where the 0.618 Fibonacci retracement level (that we talked about above) is.
Tradingview link: