- September 7, 2021
- Posted by: Tradingshot Articles
- Category: Commodities

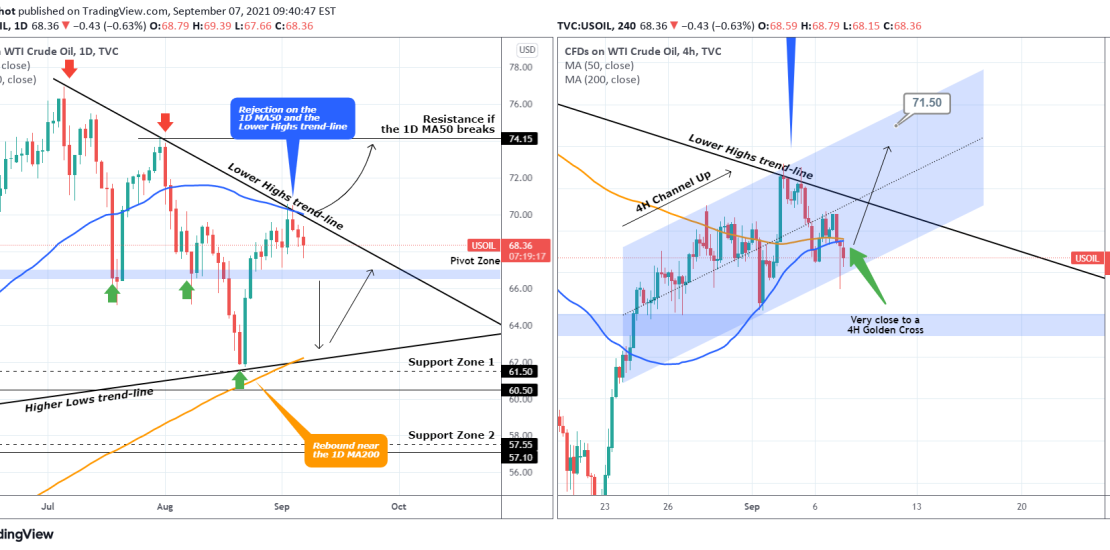
Last time I analyzed WTI Oil on August 24, I made it clear that it was trading within a long-term Triangle and until it broke, its price action would be sideways:
I stressed out the importance of the 1D MA50 (blue trend-line) and the Lower Highs trend-line of that Triangle. Well as you see on the chart, WTI Oil got rejected exactly on that Resistance level twice and has been pulling-back since. Until the price closes a 1D candle above the 1D MA50, the bias are towards the Pivot Zone. A 1D closing below it, sees the 1D MA200 (orange trend-line) as target, which last time held (August 20-23). That is on the left chart which is on the 1D time-frame.
On the 4H time-frame (right chart), a Channel Up has been formed, which naturally is limited by the Lower Highs trend-line (and 1D MA50) of the Triangle. The previous 4H candle, even though it broke below the Channel Up, it managed to close inside it, so as long as we close within the pattern, the short-term target is 71.50. On the long-term, as shown on the 1D chart, it is the 74.15 Resistance.
Tradingview link:
https://www.tradingview.com/chart/USOIL/rX7EHR24-WTI-OIL-analysis-on-the-1D-and-4H-time-frames


