

-
XAUUSD Buy Signal
- February 6, 2020
- Posted by: Tradingshot Articles
- Category: Commodities
No Comments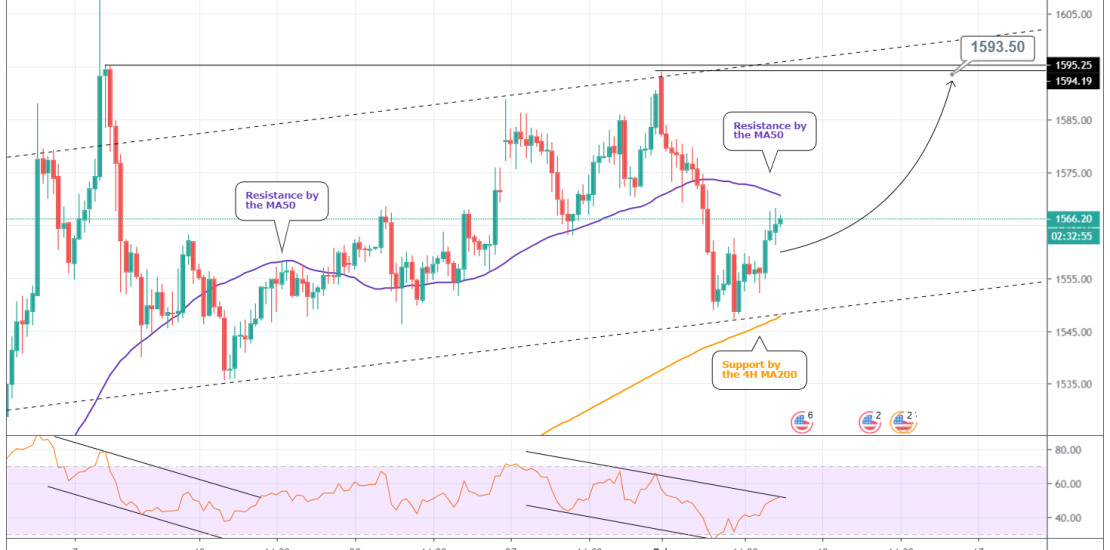
Pattern: Channel Up on 4H. Signal: Bullish as the price rebounded on the Higher Low trend line of the pattern while also finding Support on the 4H MA200. Target: 1593.50 (right below the Resistance level). Recent signals on Gold: Tradingview link: https://www.tradingview.com/chart/XAUUSD/Nz8hVhxs-XAUUSD-Buy-Signal
-
XAUUSD Buy Signal
- January 28, 2020
- Posted by: Tradingshot Articles
- Category: Commodities
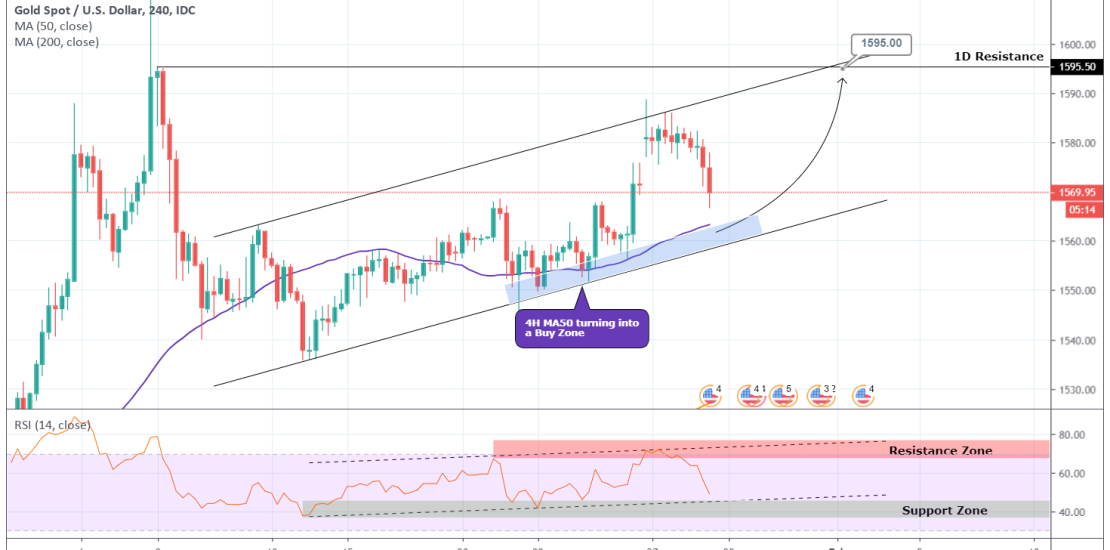
Pattern: Channel Up on 4H. Signal: Bullish once the price enters the MA50 buy zone. Target: 1595 (1D Resistance). Previous successful Buy Signal: Tradingview link: https://www.tradingview.com/chart/XAUUSD/XwahT7r0-XAUUSD-Buy-Signal
-
XAUUSD Buy Signal
- January 17, 2020
- Posted by: Tradingshot Articles
- Category: Commodities
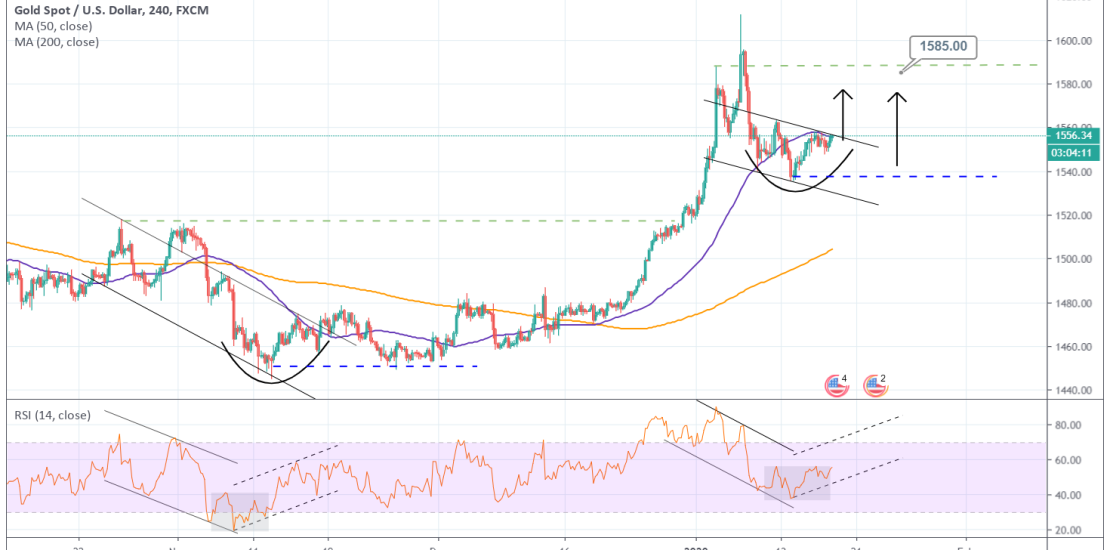
Pattern: Channel Down on 4H. Signal: Bullish if the Lower High trend line of the pattern breaks as the RSI is already on a bullish divergence similar to November. Target: 1585 (symmetrical Resistance). Tradingview link: https://www.tradingview.com/chart/XAUUSD/bOAYK6BZ-XAUUSD-Buy-Signal
-
XAUUSD Consolidation/ Buy Signal
- January 9, 2020
- Posted by: Tradingshot Articles
- Category: Commodities
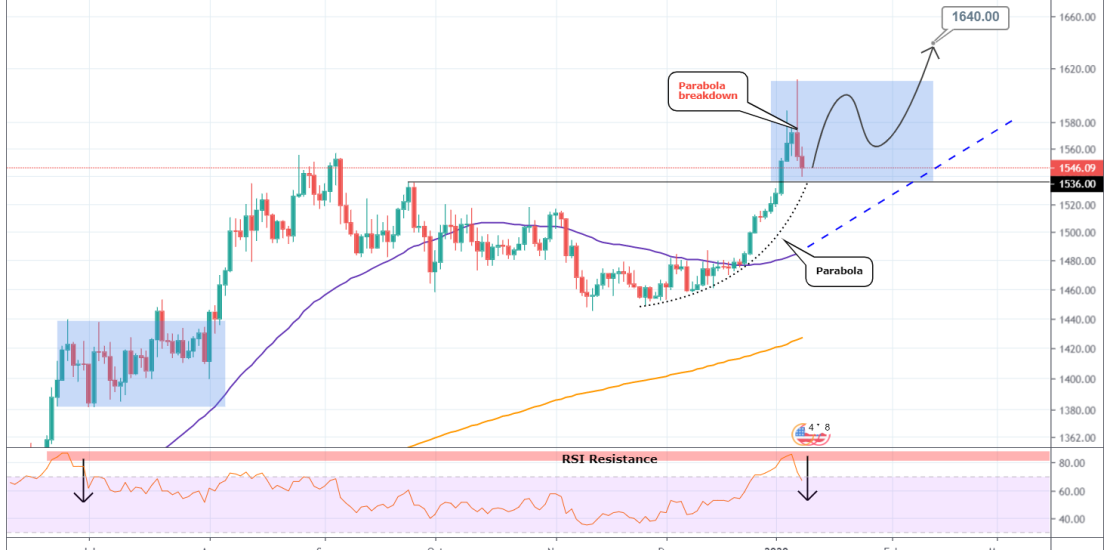
Pattern: Parabolic rise on 1D. Signal: Bullish as after the parabola broke down, the price reached the Support getting rejected on the 6-month RSI Resistance Zone. Target: 1640. Tradingview link: https://www.tradingview.com/chart/XAUUSD/MZKYkqhG-XAUUSD-Consolidation-Buy-Signal
-
XAUUSD Buy signal (and continuation level)
- December 11, 2019
- Posted by: Tradingshot Articles
- Category: Commodities
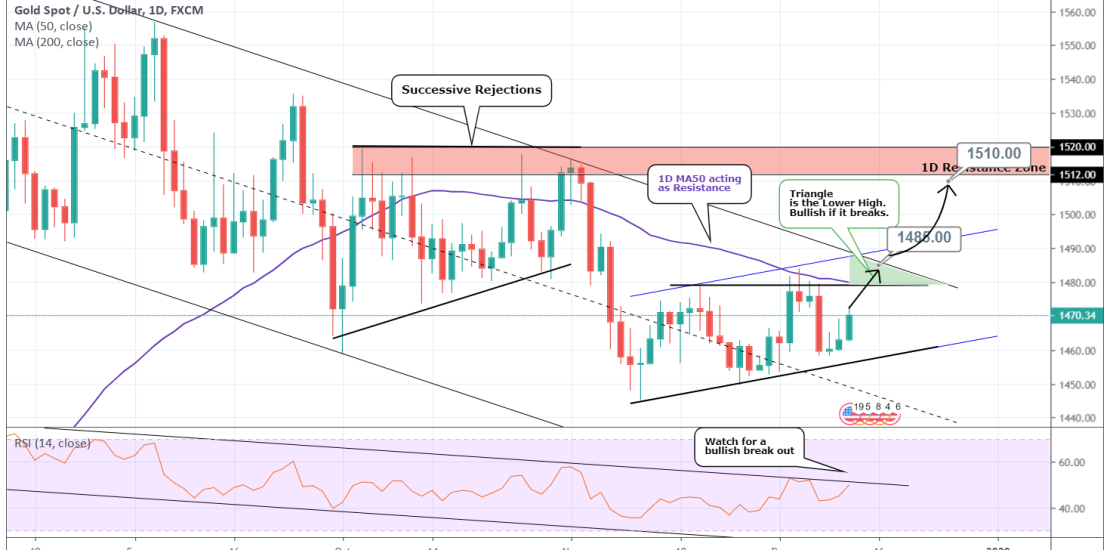
Pattern: Channel Up on 1D (blue channel). Signal: Bullish as the price is rebounding on the Higher Low. Target: 1485 (Lower High of 1W Channel Down). * Observe the 1D RSI, if it breaks above its Channel Down we may have a bullish break out of the 1W Channel Down. Basically is the Green Triangle
-
WTI OIL Neutral sentiment. Trade the break-out.
- November 21, 2019
- Posted by: Tradingshot Articles
- Category: Commodities
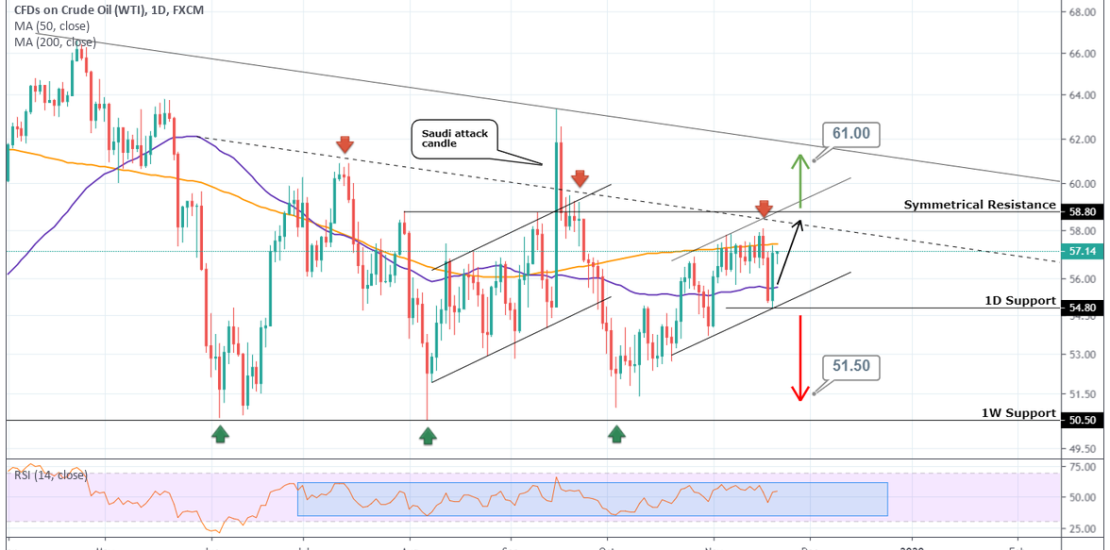
Pattern: 1W Descending Triangle . Signal: Bullish within the 1D Channel Up. Neutral outside so trade the break out: (A) Bullish above the 58.80 Symmetrical Resistance, (B) Bearish below the 54.80 1D Support. Target: Within the 1D Channel Up it is always the 58.80 Resistance. Outside is (A) = 61.00, (B) = 51.50. See how
-
WTI OIL Bullish Trading plan
- September 5, 2019
- Posted by: Tradingshot Articles
- Category: Commodities
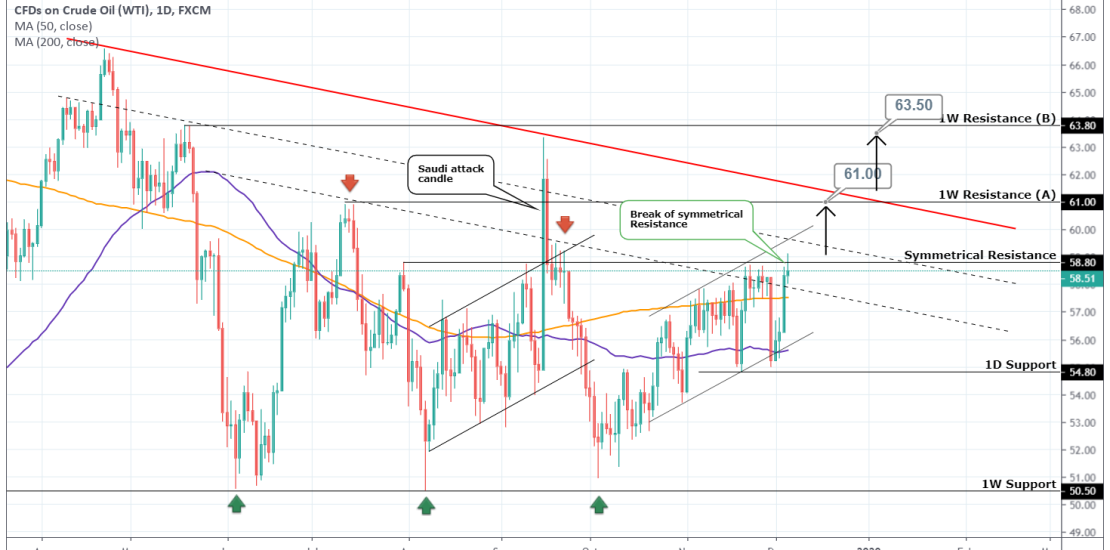
Pattern: 1D Channel Up. Signal: Bullish as the price broke the 58.80 Symmetrical Resistance, which (excluding the Saudi attack on September 16th) has been holding since July. Target: 61.00 (1st 1W Resistance) and if the Lower High trend line (red bold) of the Descending Triangle breaks, 63.50 (2nd 1W Resistance). See how accurate the 1W
-
PLATINUM Buy Signal
- September 4, 2019
- Posted by: Tradingshot Articles
- Category: Commodities
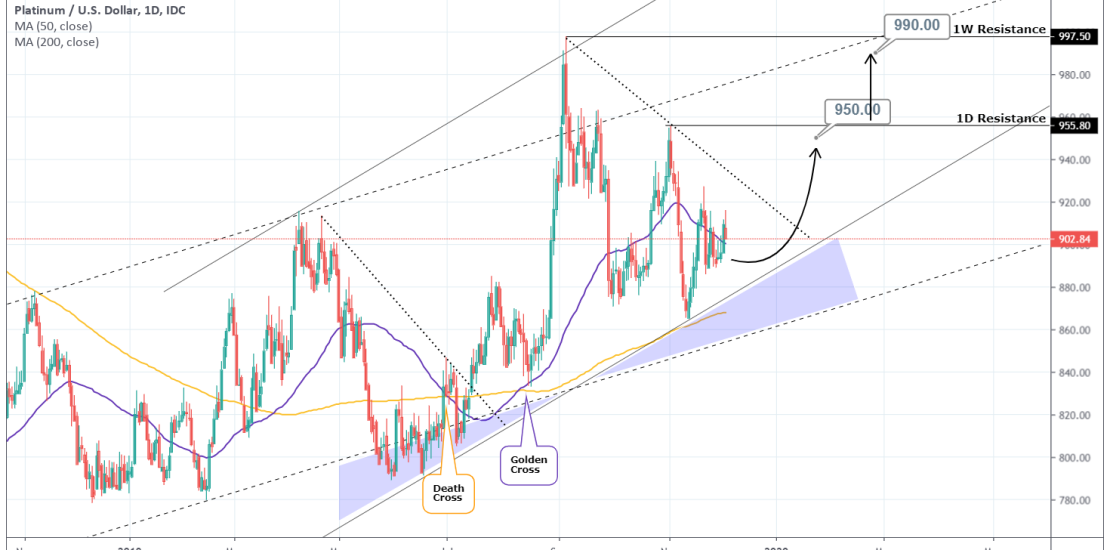
Pattern: Channel Up on 1M. Signal: Bullish as the price is approaching the Higher Low zone of the pattern. Target: 950 (below the 1D Resistance) and 990 (below the 1W Resistance). Tradingview link: https://www.tradingview.com/chart/XPTUSD/IoyZSGUi-PLATINUM-Buy-Signal
-
COPPER Buy Signal
- September 2, 2019
- Posted by: Tradingshot Articles
- Category: Commodities
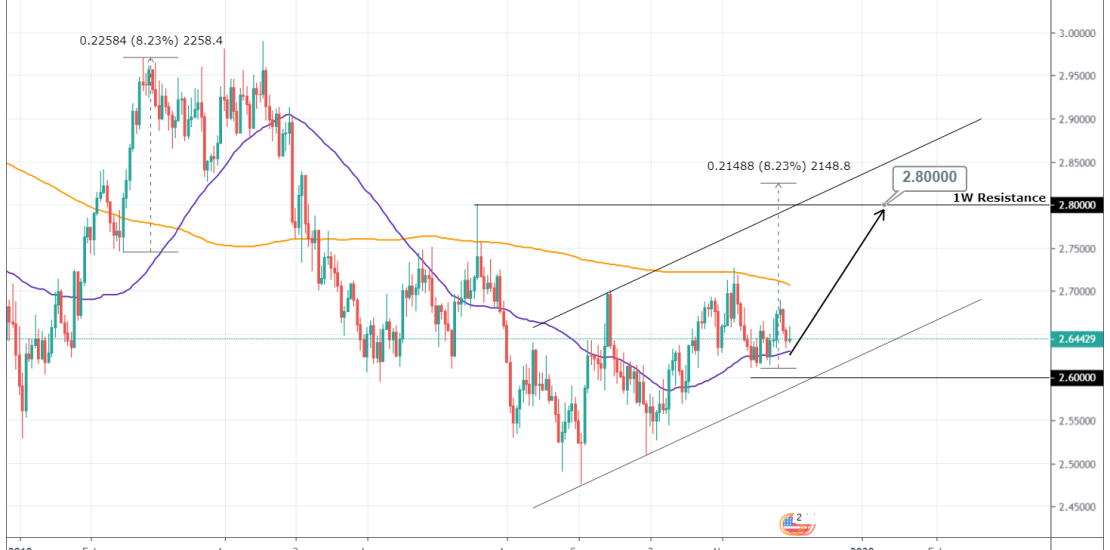
Pattern: Channel Up on 1D. Signal: Bullish as long as the 2.6000 level holds (Higher Low lim). Target: 2.8000 (1W Resistance). Tradingview link: https://www.tradingview.com/chart/XCUUSD/1RNtvoCT-COPPER-Buy-Signal