

- September 17, 2021
- Posted by: Tradingshot Articles
- Category: Commodities
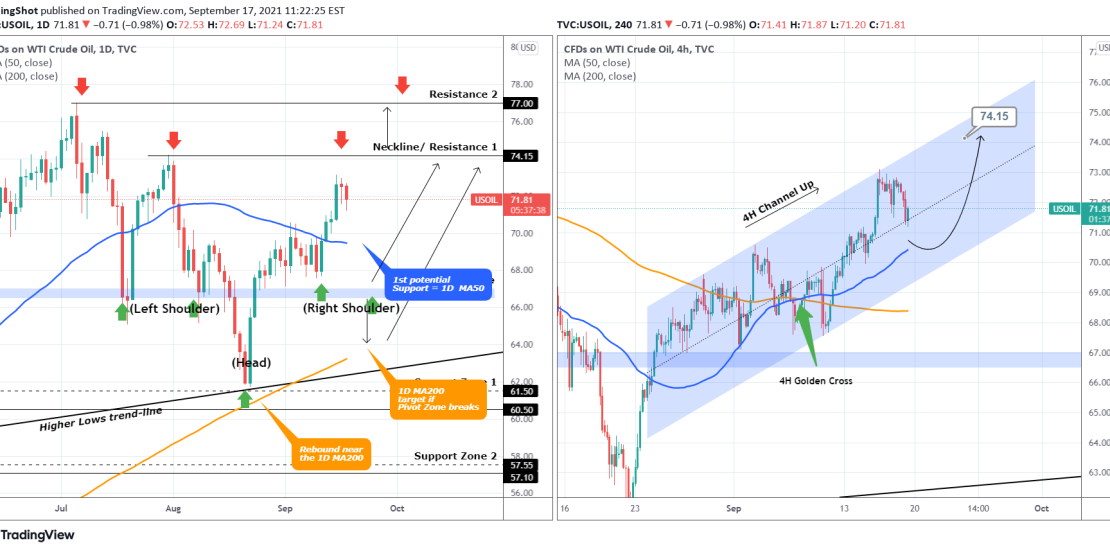
Last time I made a post on WTI Oil the price was still struggling to get past both a very strong Lower Highs trend-line and the 1D MA50 (blue trend-line on the left chart):

Well the price managed to break and close above both and rallied. The rejection though near the 74.15 Resistance has formed an Inverse Head and Shoulders (IH&S). Look how the Pivot Zone mentioned on the previous analysis is almost perfectly matched as the Shoulder line. Naturally, we should be expecting an initial pull-back and since the IH&S is a bullish reversal pattern, break above the 74.15 afterwards.
However we need to consider an earlier potential Support and that’s the 1D MA50 which, as mentioned, was previously the Resistance since August 03. That fits well the pattern on the right side (which is on the 4H time-frame) which is a Channel Up whose Higher Lows trend-line limit is currently roughly where the 1D MA50 is.
Short-term target if the Pivot Zone holds is the 74.15 Resistance (1). Long-term target is the 77.00 Resistance (2). A candle close below the Pivot Zone temporarily sets this back to the 1D MA200 (orange trend-line on the left chart).
Tradingview link:
https://www.tradingview.com/chart/USOIL/3UDh7deF-WTI-OIL-Inverse-Head-and-Shoulders