
-
WTI OIL Buy Signal
- April 26, 2021
- Posted by: Tradingshot Articles
- Category: Commodities
No Comments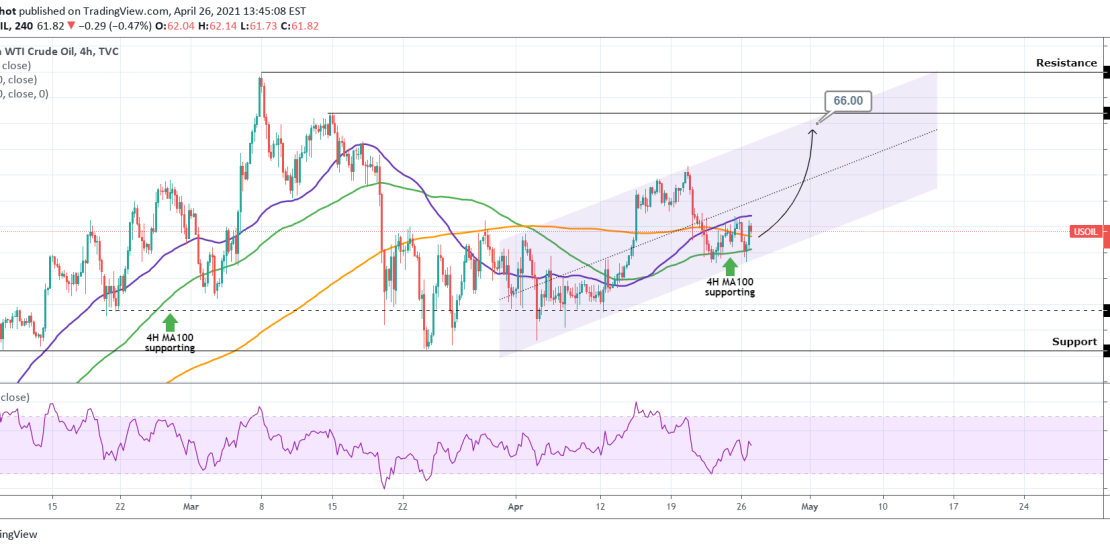
Pattern: Channel Up on 4H. Signal: Buy as the price rebounded on the Higher Lows trend-line of the Channel and is supported by the 4H MA100 (green trend-line), which has been the Support on the November 2020 – February 2021 uptrend. Target: 66.00 (just below the 66.40 Resistance). Tradingview link: https://www.tradingview.com/chart/USOIL/wzDCbhFJ-WTI-OIL-Buy-Signal
-
WTI OIL First 4H Golden Cross since November!
- April 21, 2021
- Posted by: Tradingshot Articles
- Category: Commodities
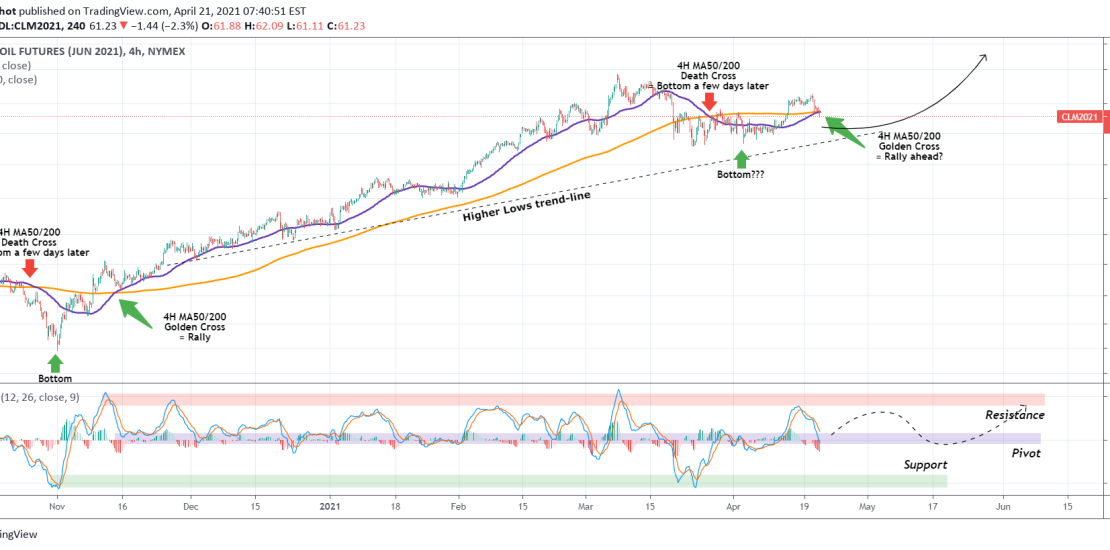
WTI Crude Oil has just formed a Golden Cross on the 4H chart (MA50 (blue trend-line) crossing above the MA200 (orange trend-line)), the first since November 12, 2020. The price action since March 12 is quite similar to late October – early November. After the Death Cross on October 27, 2020, a bottom was
-
NATURAL GAS 1st Higher High since mid February. Buy.
- April 19, 2021
- Posted by: Tradingshot Articles
- Category: Commodities
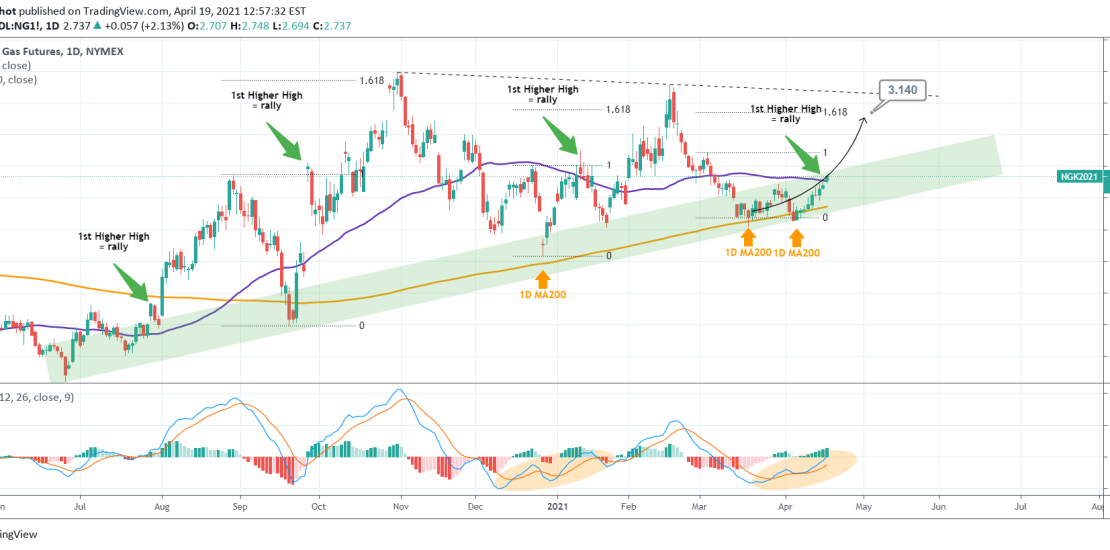
Pattern: Triangle on 1D. Signal: Buy as the price has rebounded on the 1D MA200 (orange trend-line) and formed the 1st Higher High since February 17. After a Higher High, a rally was always followed since July 2020. Target: 3.140 (the 1.618 Fibonacci extension ). Most recent signal on NG: ** Please support this
-
COPPER Buy Signal
- April 19, 2021
- Posted by: Tradingshot Articles
- Category: Commodities
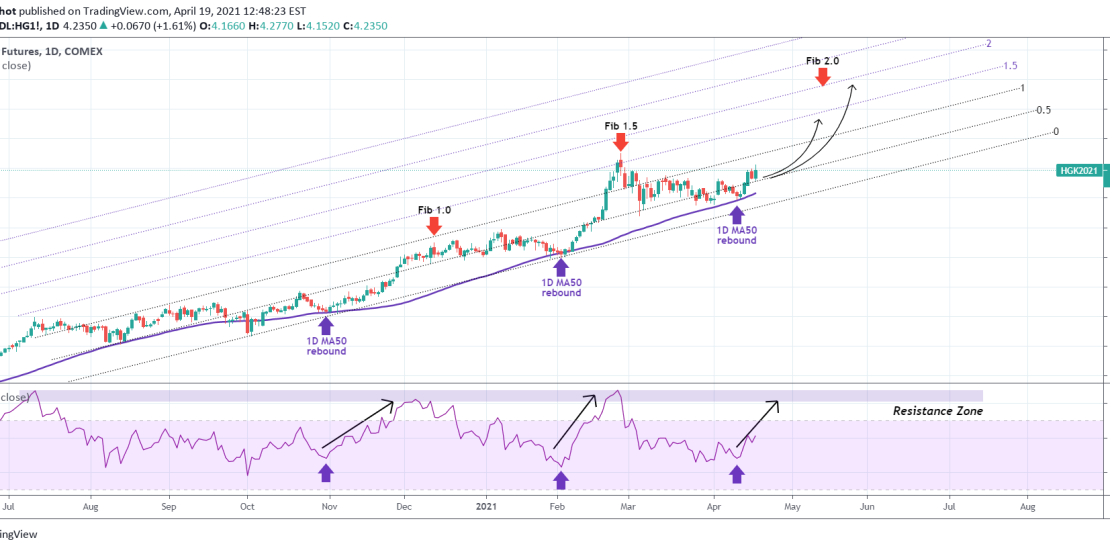
Pattern: Fibonacci Channel on 1D. Signal: Buy as the price rebounded on the 1D MA50. Target: The 1.5 Fibonacci extension level (low-risk) or the 2.0 Fibonacci level (high-risk). Previous COPPER signal: ** Please support this idea with your likes and comments, it is the best way to keep it relevant and support me. **
-
GOLD broke the 1760 and 1D MA50 for the 1st time since February!
- April 15, 2021
- Posted by: Tradingshot Articles
- Category: Commodities

Finally the precious metal has broken above the 1760 Resistance which has been holding since February 26. The reason behind it wasn’t the DXY or the rise on stocks but the strong daily sell-off on the US10Y, which broke below its own 4H MA200 for the first time since November! Whether that is enough
-
URANIUM Time to go on a big buy?
- April 12, 2021
- Posted by: Tradingshot Articles
- Category: Commodities
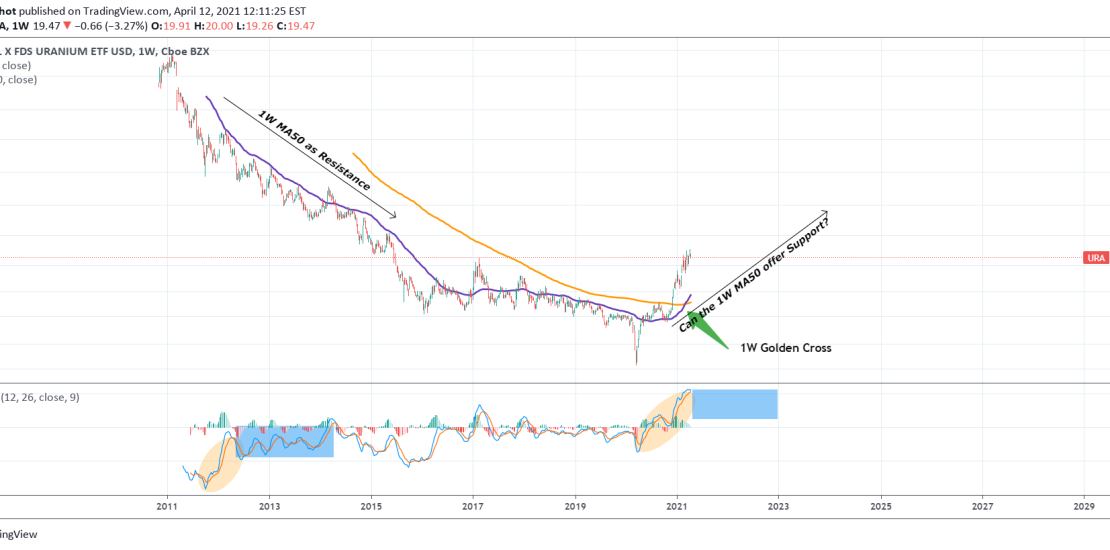
The Uranium ETF has sustained an uptrend since March 2020, with is rise resembling other bullish stock markets. Perhaps the most important development is the formation of the Golden Cross (MA50 crossing above the MA200) on the 1W time-frame. The 1W MA50 (blue trend-line) has been the Resistance throughout its multi-year downtrend. Can it
-
GOLD First 4H Golden Cross since December! Bullish or not?
- April 9, 2021
- Posted by: Tradingshot Articles
- Category: Commodities
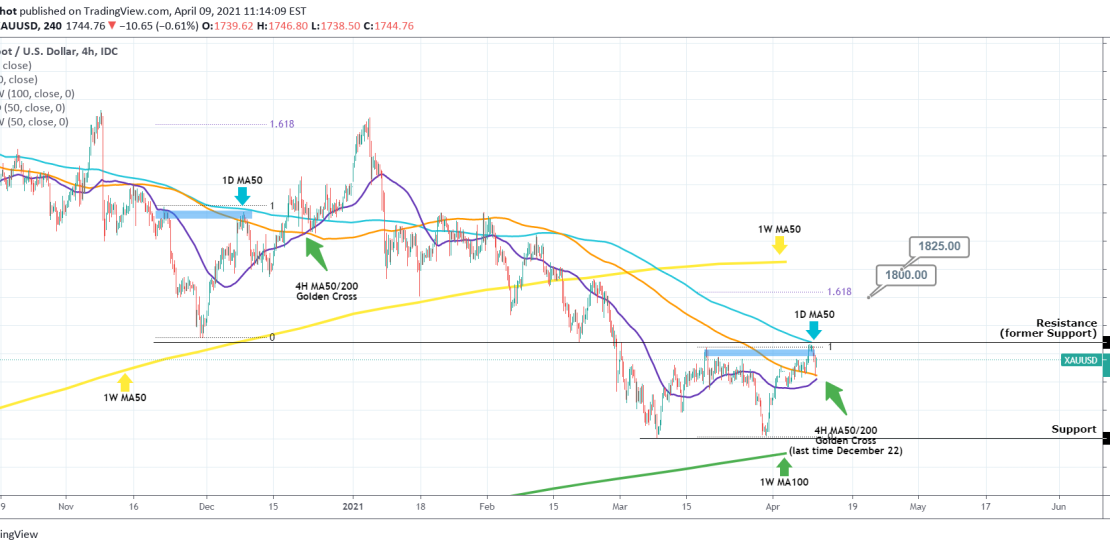
Gold reached yesterday the 1760 Resistance which is a very critical level as it may currently be the Resistance (since March 01) but is a Pivot as it was formerly a Support (two contacts: November 30, 2020 and February 18, 2021). It is no surprise that the price got rejected there as besides the
-
WTI OIL Emerging 4H MA50/100 Golden Cross. Rally ahead?
- April 8, 2021
- Posted by: Tradingshot Articles
- Category: Commodities
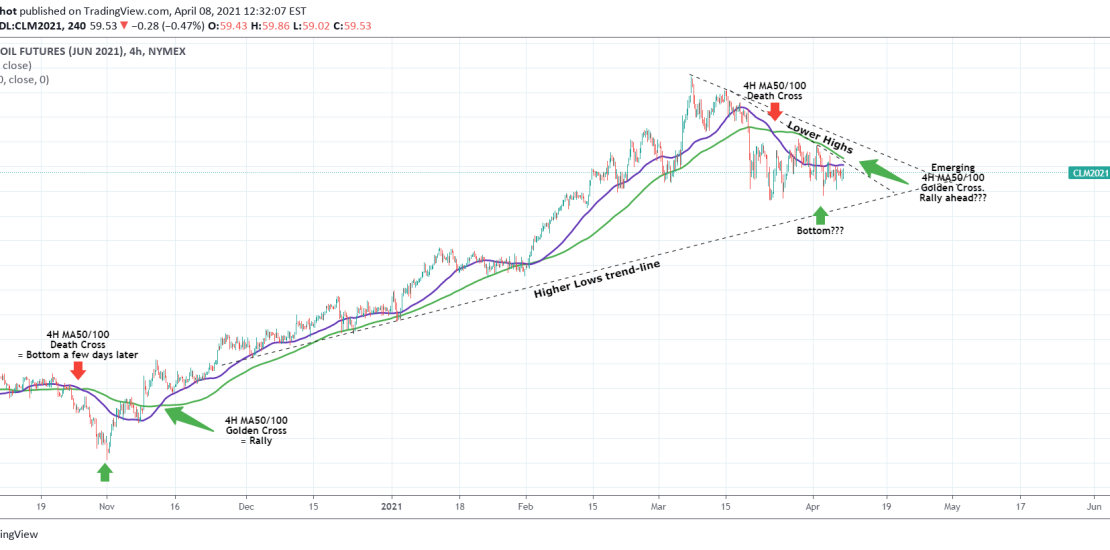
Simple fractal comparison on WTI as the price is consolidating since the March 23 low and is approaching the Higher Lows trend-line that started on December 01. As you see the current price action is quite similar to the late October – early November one. After the 4H MA50 crossed below the 4H MA100, a
-
GOLD The peculiar 4H MA50/100 Cross divergence
- March 31, 2021
- Posted by: Tradingshot Articles
- Category: Commodities
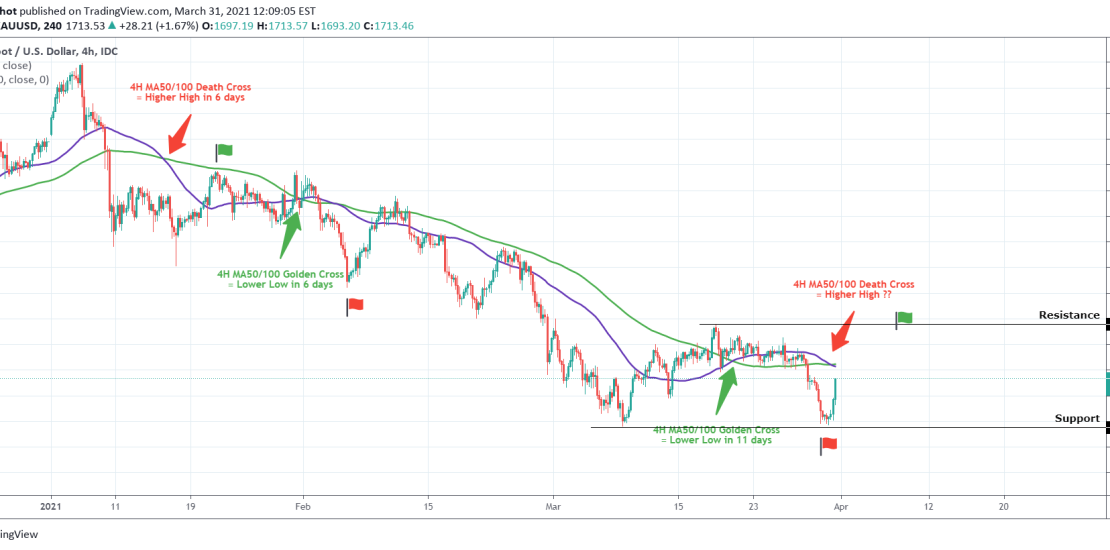
Today Gold is on a strong rebound as it held the 1675.50 Support made from the March 08 Low. But the reason for this short post is to bring forward the counter signal that the MA50/ 100 Cross give on the 4H time-frame. As you see on the chart since January 14 the MA50
-
GOLD aims at $1850. Similarities with December 2020.
- March 26, 2021
- Posted by: Tradingshot Articles
- Category: Commodities
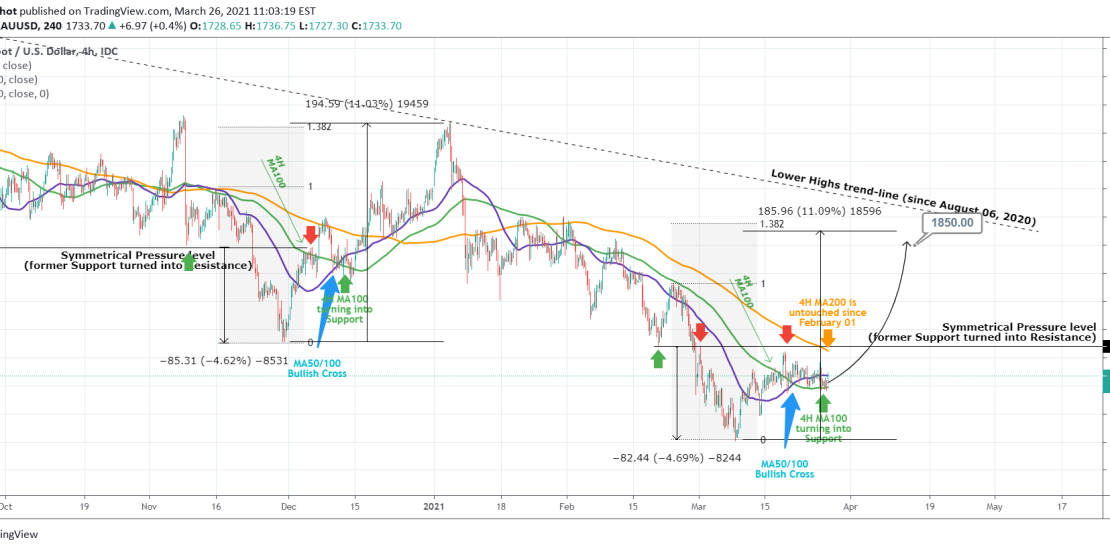
This is a fractal comparison on XAUUSD between the current sequence and that of December 2020. At the moment Gold is trading on top of the 4H MA100 (green trend-line) using it as a Support and around the 4H MA50 (blue trend-line) using it as a Pivot. It still hasn’t broken above neither the
