

- September 3, 2021
- Posted by: Tradingshot Articles
- Category: Commodities
My most recent Gold signal was on the short-term time-frame of 4H:

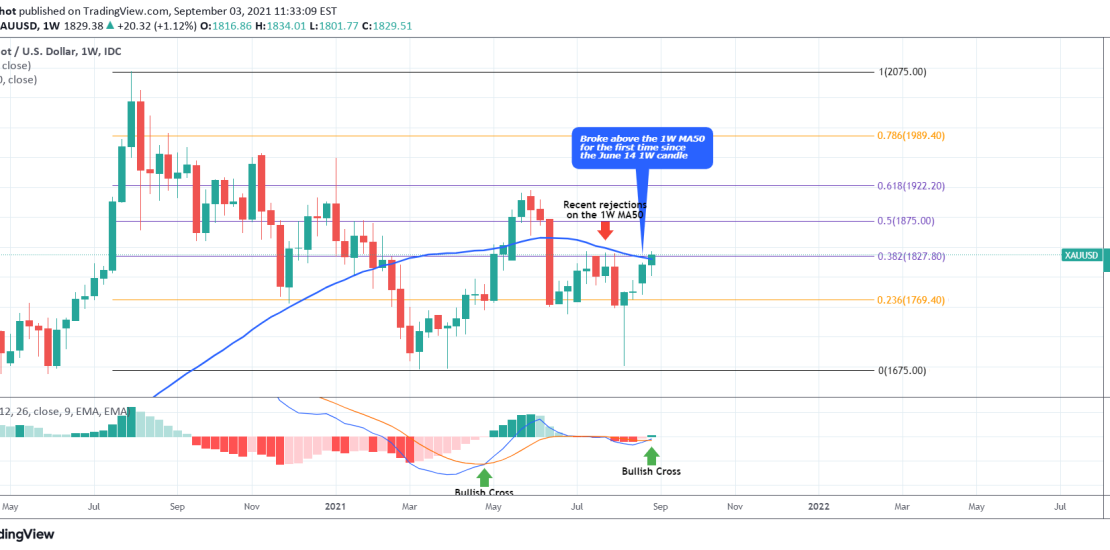
This time we have a significant technical development on long-term and I’ve moved us to the 1W time-frame where XAUUSD just broke above the 1W MA50 (blue trend-line) for the first time since the June 14 weekly candle. Closing the week above this level should be enough to restore the bullish sentiment on the long-term as the 1W MA50 acted as a Resistance on four straight weekly candles in July and August.
Naturally if the price makes that weekly closing, the target should be the 1,915 High of May, which just below the 0.618 Fibonacci retracement level. As you see those levels have been acting quite accurately as Resistance/ Support levels since the August 2020 market top.
Note: The 1W MACD made a Bullish Cross. Last time that happened (April 26 candle), a very strong rally followed.
Tradingview link: