
-
XLMUSDT Failing to break the 1D MA50.
- June 7, 2022
- Posted by: Tradingshot Articles
- Category: Cryptocurrency
No Comments
*** *** For this particular analysis on STELLAR we are using the XLMUSDT symbol on the Phemex exchange. *** *** The idea is on the 1D time-frame where Stellar Lumen has been consolidating since its May 31 short-term High, which is still a Lower High within the Channel Down pattern that started in November
-
NASDAQ Sideways but still off the top of the Channel Down
- June 6, 2022
- Posted by: Tradingshot Articles
- Category: Stock Indices
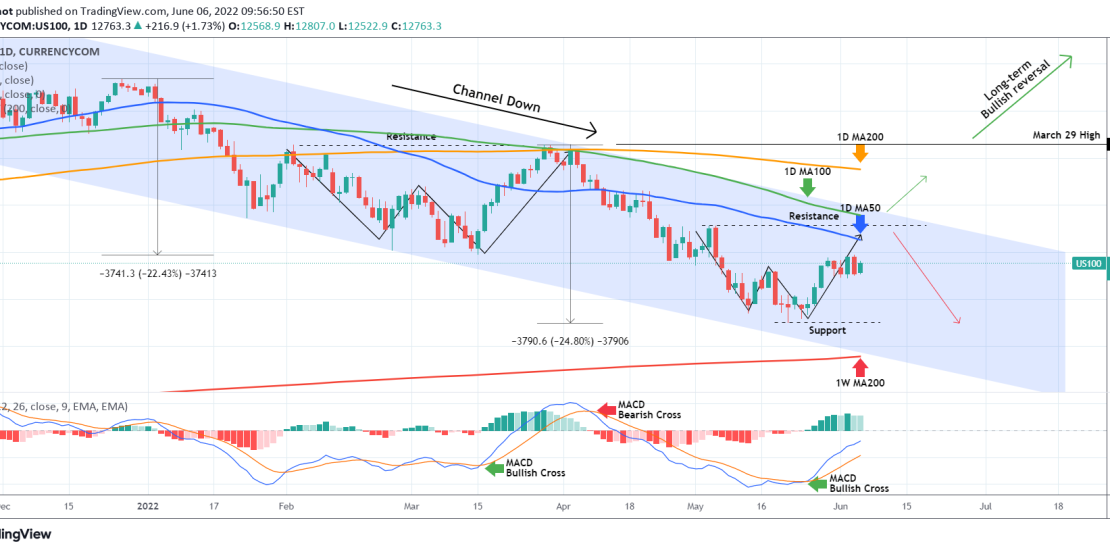
Nasdaq (NDX) has been trading sideways since May 30. The 1D MA50 (blue trend-line) is right above with the 1D MA100 (green trend-line) being roughly around the Lower Highs (top) trend-line of the Channel Down. Based on our previous analysis 2 weeks ago, the index was on a W pattern aiming at the Resistance
-
DOW JONES Consolidating below the 1D MA50 for a week
- June 6, 2022
- Posted by: Tradingshot Articles
- Category: Stock Indices
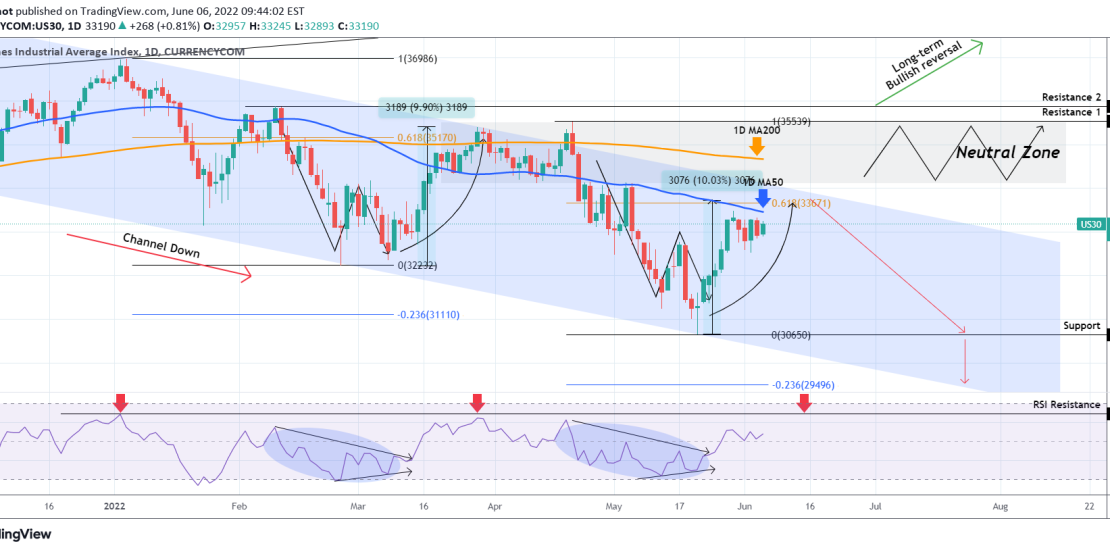
Dow Jones (DJI) eventually rebounded at the bottom (Lower Lows trend-line) of its long-term Channel Down, since our last analysis that indicated a sold R/R ratio for going long: Since the end of May though, the index has failed just before a 1D MA50 (blue trend-line) test and turned sideways below that level. This
-
XAUUSD Still bearish unless this level breaks
- June 6, 2022
- Posted by: Tradingshot Articles
- Category: Commodities
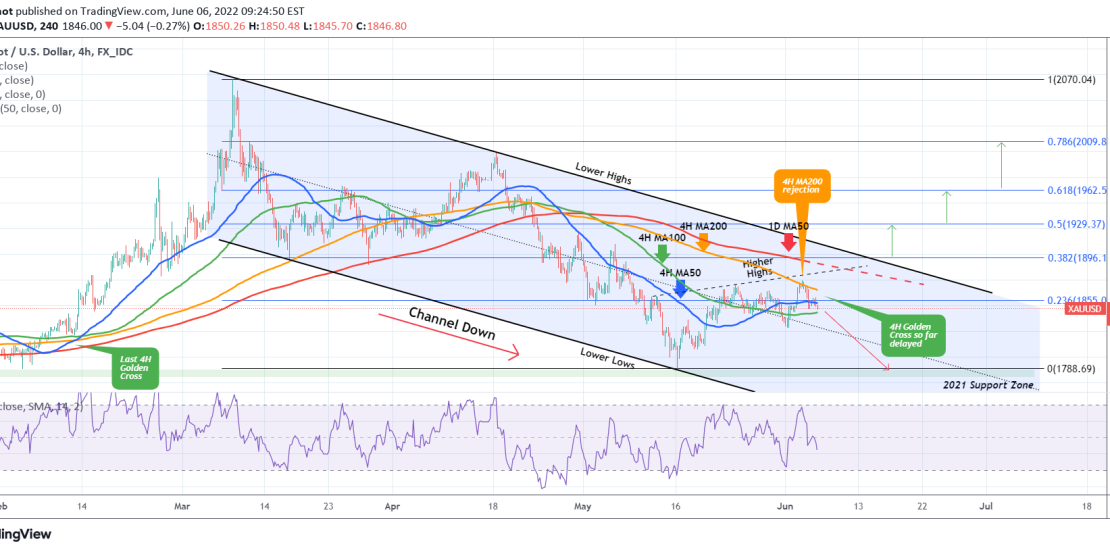
Gold (XAUUSD) has established a Channel Down pattern since its March 08 peak during the Ukraine – Russia war. Since May 16 it has been forming its new leg to a Lower High but three sessions ago it got rejected on the 4H MA200 (orange trend-line), cutting the uptrend from a 1D MA50 test
-
EURUSD Testing the Lower Highs of the 4 month Channel Down
- June 6, 2022
- Posted by: Tradingshot Articles
- Category: Forex
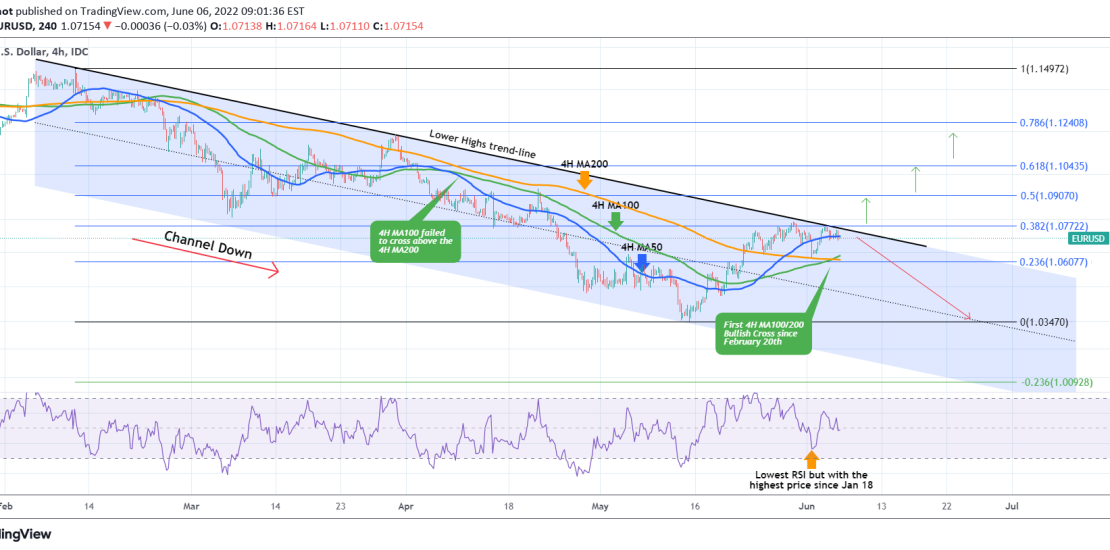
The EURUSD pair has been trading near the Lower Highs (top) trend-line of the 4 month Channel Down for the past 5 days. During this time the price tested the 4H MA200 (orange trend-line) as a Support and held. The longer it does, the stronger the buyer accumulation for breaking above the Lower Highs
-
MANAUSDT Bearish unless this level breaks
- June 3, 2022
- Posted by: Tradingshot Articles
- Category: Cryptocurrency
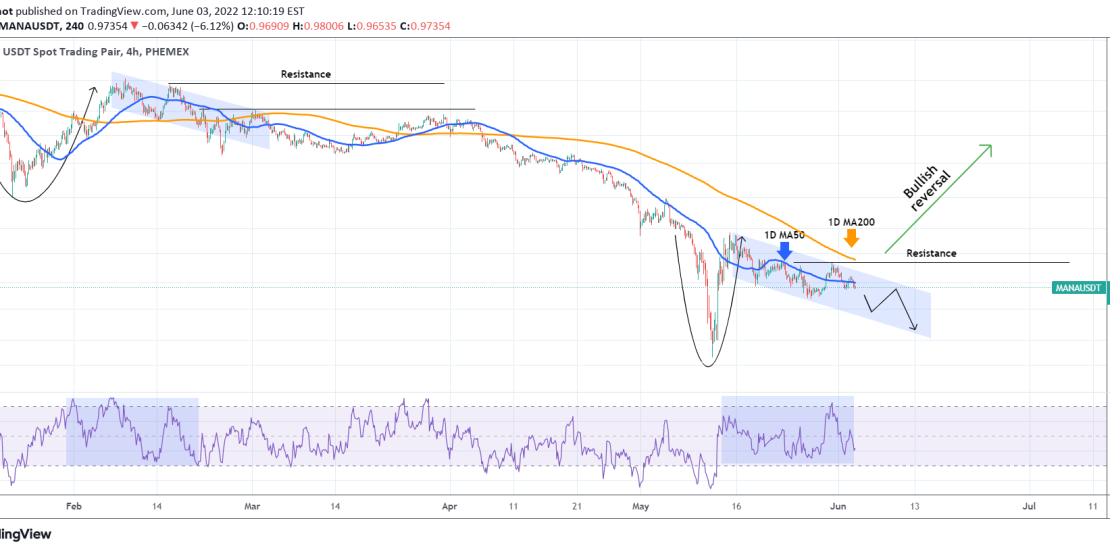
*** *** For this particular analysis on DECENTRALAND we are using the MANAUSDT symbol on the Phemex exchange. *** *** The idea is on the 4H time-frame where Mana has been trading within a Channel Down since the May 14 High. That is still a Lower High within the general bearish trend and the
-
BNBUSD Long-term action plan
- June 2, 2022
- Posted by: Tradingshot Articles
- Category: Cryptocurrency

The Binance Coin (BNBUSD) has been consolidating with the 1W MA100 (yellow trend-line) as its Support ever since the May 12 bottom and subsequent rebound. On a 1 year basis this is the ultimate range with the 705.00 Resistance and the 209.00 Support each being tested twice. There is a strong similarity between this
-
AUDJPY forming a bullish pattern
- June 2, 2022
- Posted by: Tradingshot Articles
- Category: Forex
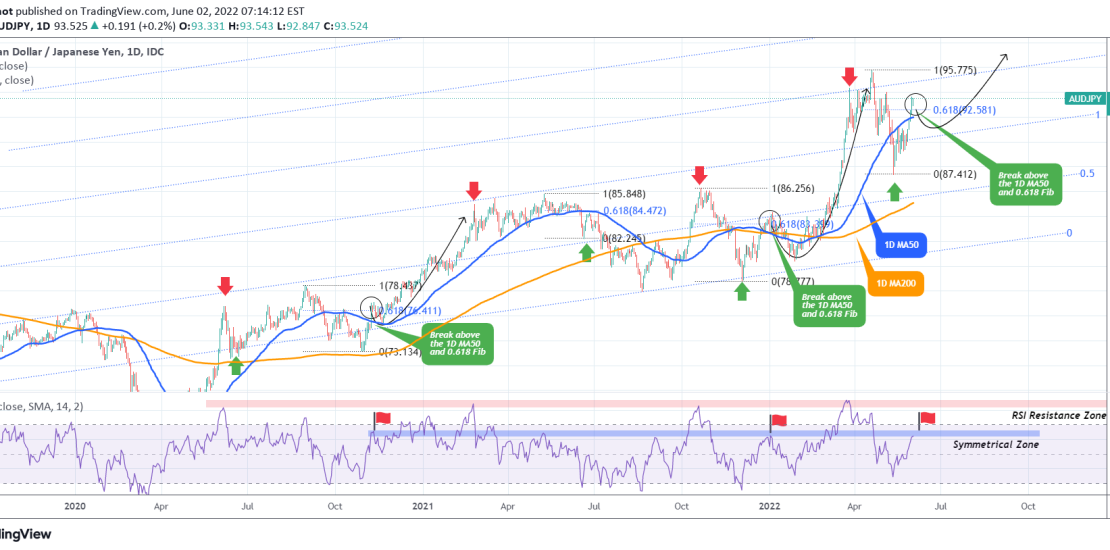
This is an update of the AUDJPY pair on my previous sell signal upon the 1D RSI Resistance rejection, as illustrated below: With the price now recovered from the sub 88.000 level, the pair is waving a buy signal as it broke above both the 1D MA50 (blue trend-line) and the 0.618 Fibonacci retracement
-
INFLATION testing a 100 year old trend-line. How will S&P react?
- June 2, 2022
- Posted by: Tradingshot Articles
- Category: Other, Stock Indices
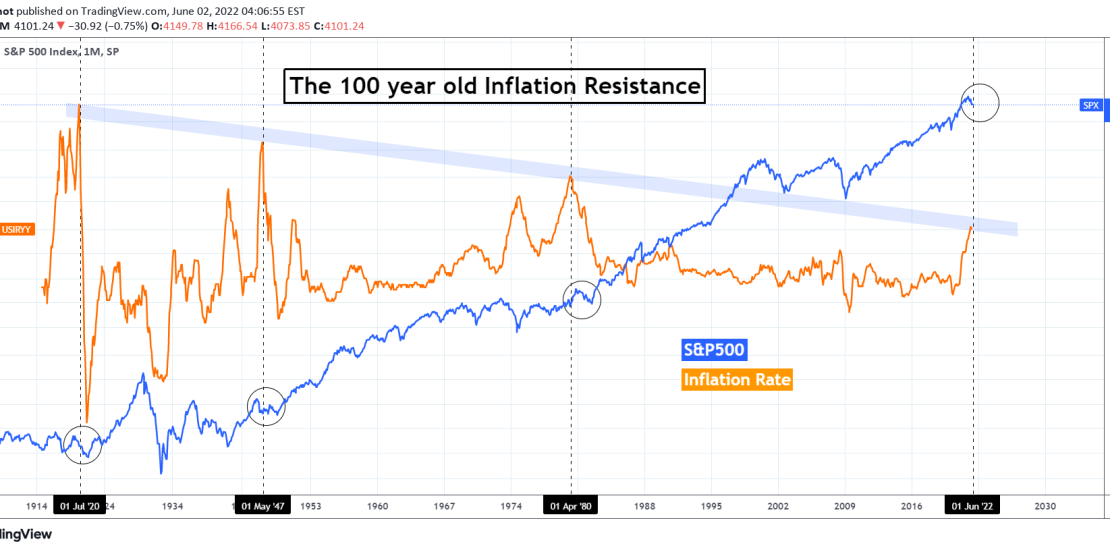
This is an interesting analysis as the U.S. Inflation Rate (orange trend-line) is testing for the first time since early 1980 a Lower Highs trend-line that started after the High of July 1920, exactly 100 years ago! This Lower Highs trend-line has made another 2 contacts after that and it is interesting to see
-
DXY Testing the RSI Support that started the 2021/22 rally
- May 31, 2022
- Posted by: Tradingshot Articles
- Category: Forex
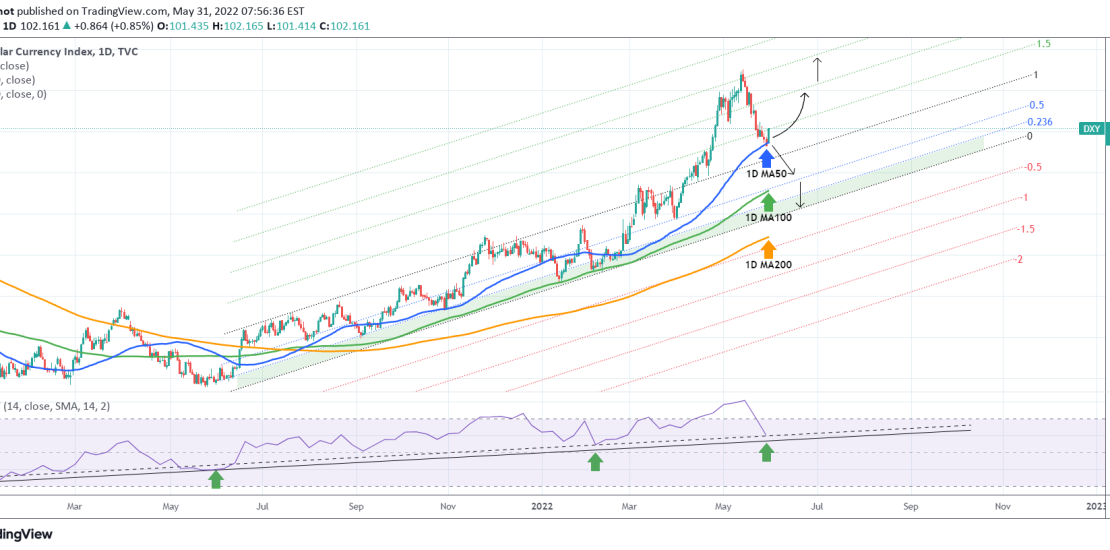
The U.S. Dollar Index (DXY) hit yesterday the 1D MA50 (blue trend-line) for the first time since February 23. Today’s rebound simply shows why this MA level is considered such an important short/ medium-term Support. As long as it holds, expect a rebound to the upper Fibonacci extension levels of 2.0 and 2.5 that
