
-
NETFLIX 1D Golden Cross historically shows fast recovery.
- December 2, 2022
- Posted by: Tradingshot Articles
- Category: Stocks
No Comments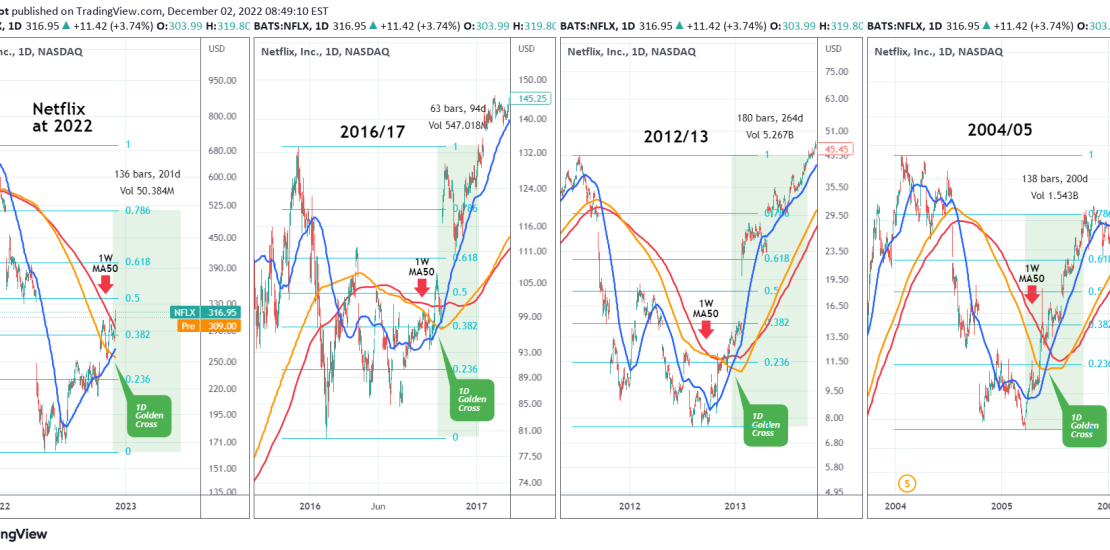
Netflix (NFLX) completed last week the Golden Cross pattern on the 1D time-frame, which is when the 1D MA50 (blue trend-line) crosses above the 1D MA200 (orange trend-line). By doing so it closed yesterday above the 1W MA50 (red trend-line) for the first time since January 06 2022, practically when its Bear Market was
-
BITCOIN & the USDT Dominance point to a fast reversal!
- December 1, 2022
- Posted by: Tradingshot Articles
- Category: Cryptocurrency
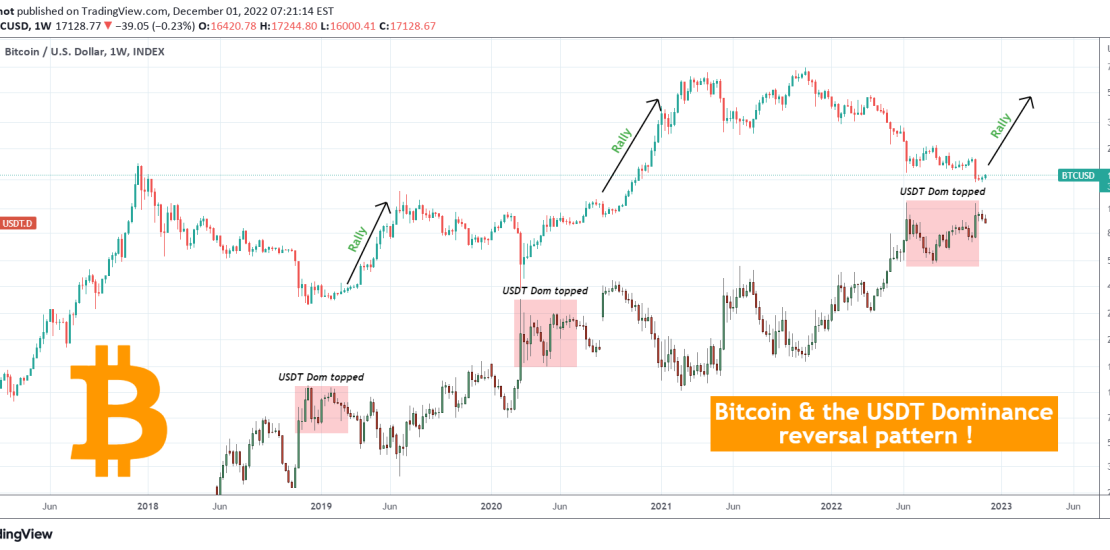
This is Bitcoin (BTCUSD) on the 1W time-frame drawn against the USDT dominance. For better comparison purposes both are displayed in candle bars, BTC being on top, USDT Dom at the bottom. The essence of this comparison is to find a behavioral pattern that can help us estimate which phase of the Cycle BTC
-
US02Y is the key for stocks and it has started to drop!
- December 1, 2022
- Posted by: Tradingshot Articles
- Category: Other
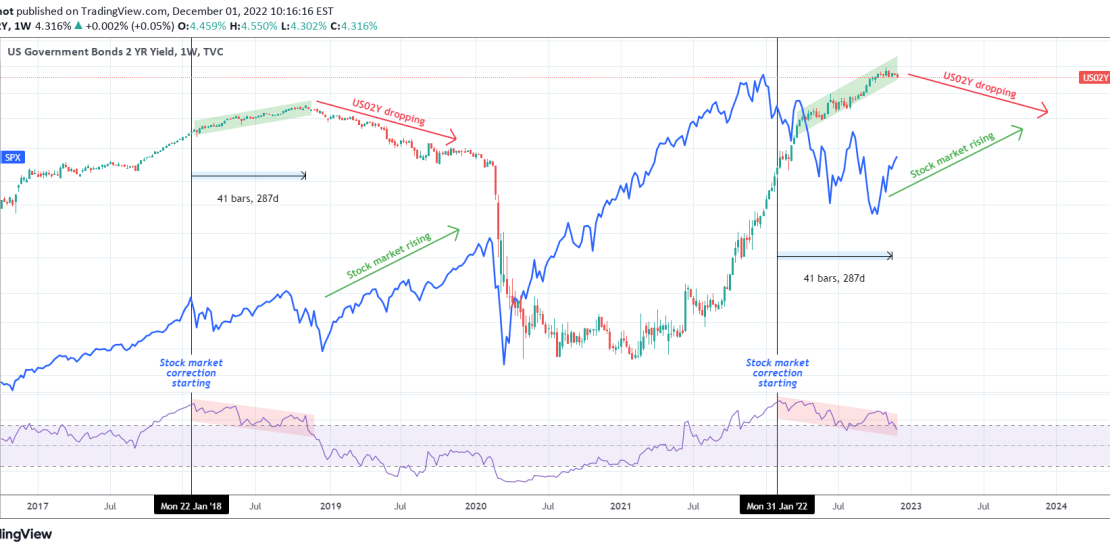
This is a 1W time-frame chart, showing the correlation between the U.S. Government Bonds 2 YR Yield and the S&P500 (blue trend-line). Some may perceive the recent 2-month rally on stocks as a coincidence but the US02Y price action shows that it is not and has a direct correlation with it. The 1W RSI
-
S&P500 What crisis? We’re still in a cyclical Bull.
- December 1, 2022
- Posted by: Tradingshot Articles
- Category: Stock Indices
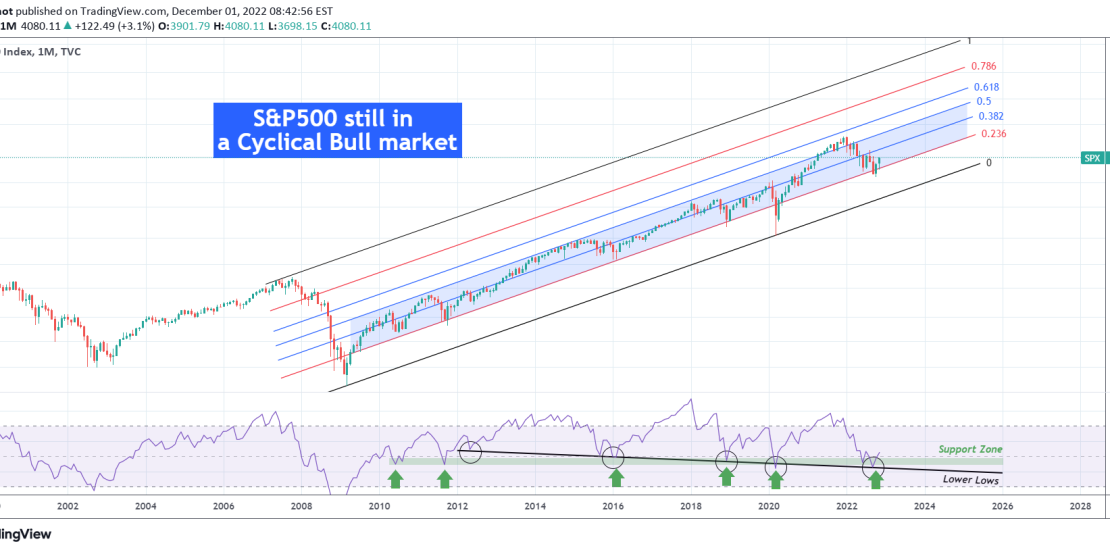
This is the S&P500 index (SPX) on the 1M (monthly) time-frame illustrating key levels and zones using the Fibonacci Channel. We focus on the price action and pattern created following the last major crisis, the 2008 housing crash. As you see, since that Bear Cycle correction, S&P500 has been trading within a steady Channel
-
RUNEUSD Is preparing a major bullish move
- November 29, 2022
- Posted by: Tradingshot Articles
- Category: Cryptocurrency
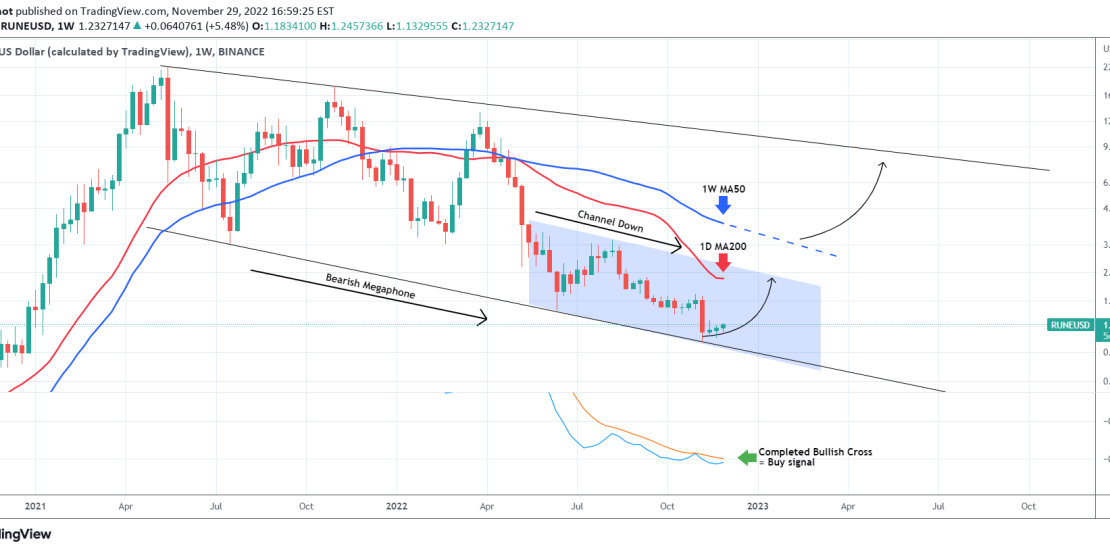
THORChain (RUNEUSD) has been trading within a Channel Down pattern since the June 13 2022 (weekly) low inside a longer-term Bearish Megaphone since the May 17 (weekly) High. The 1W LMACD is close to forming a Bullish Cross. If completed, the short-term target will be the 1D MA200 (red trend-line). A break above the
-
WALMART may be approaching the end of this rally
- November 29, 2022
- Posted by: Tradingshot Articles
- Category: Stocks
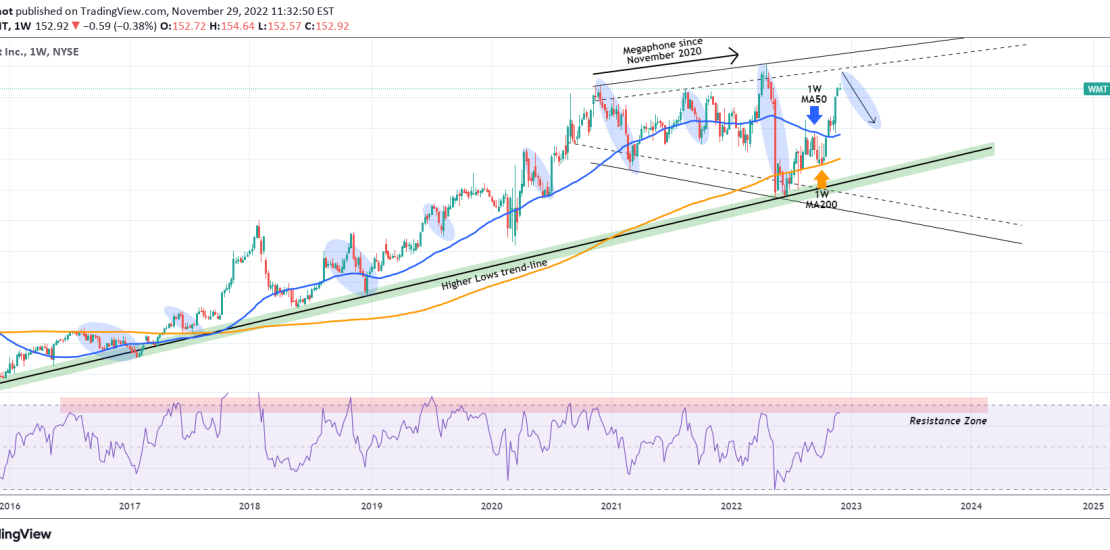
Walmart Inc. (WMT) has been rising since the low of the June 13 2022 weekly (1W) candle. Along the way it broke above the key Resistance of the 1W MA50 (blue trend-line) and after it held the 1W MA200 (orange trend-line), it has established both as Support levels long-term. There are however two longer
-
DAX ‘s incredible 8 straight green week rally may come to an end
- November 29, 2022
- Posted by: Tradingshot Articles
- Category: Stock Indices
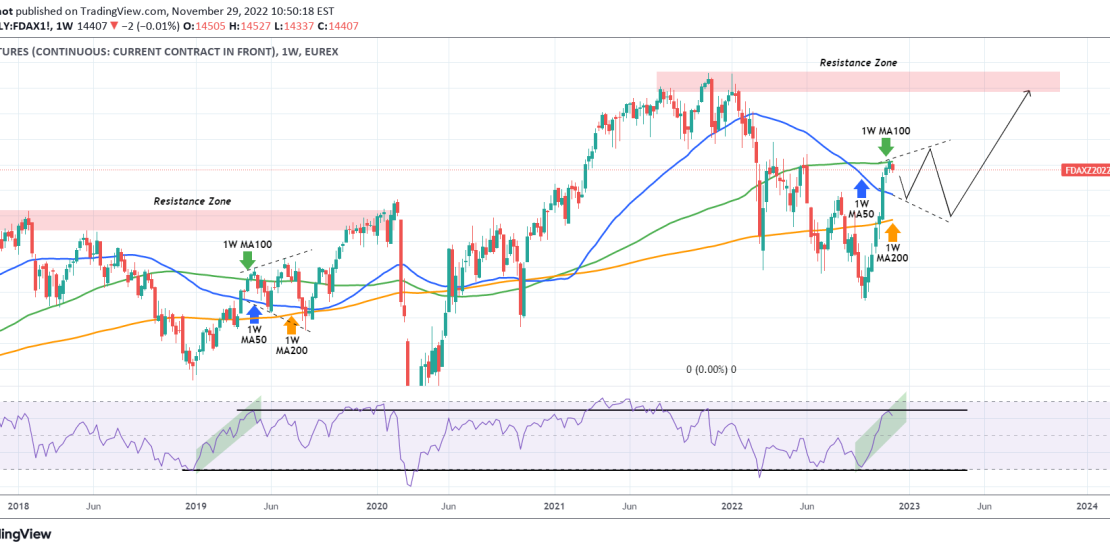
The German Index (DAX) hit last week its 1W MA100 (green trend-line) and early this week, the 1W candle is pulling-back in red. If it closes this way, it will be the first week of loss (red) since late September, running an amazing streak of 8 straight green ones. With the 1W RSI almost
-
BITCOIN Weekly RSI has bottomed and leads the way to 19k first.
- November 29, 2022
- Posted by: Tradingshot Articles
- Category: Cryptocurrency
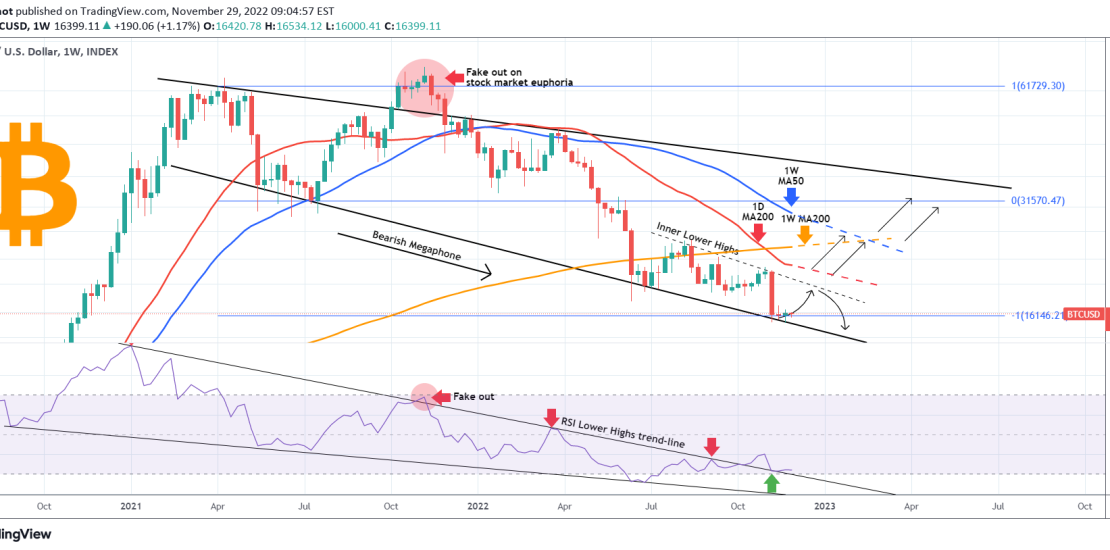
This is Bitcoin (BTCUSD) on the 1W (weekly) time-frame. The focus is on the Bearish Megaphone that has been running since the April 12 2021 High, drawn on the weekly candle bodies, ignoring the wicks. This is the pattern that has been dominating the whole Bear Cycle since its beginning, with the October –
-
DXY hit the 1D MA20 for the first time since June 2021!
- November 28, 2022
- Posted by: Tradingshot Articles
- Category: Forex
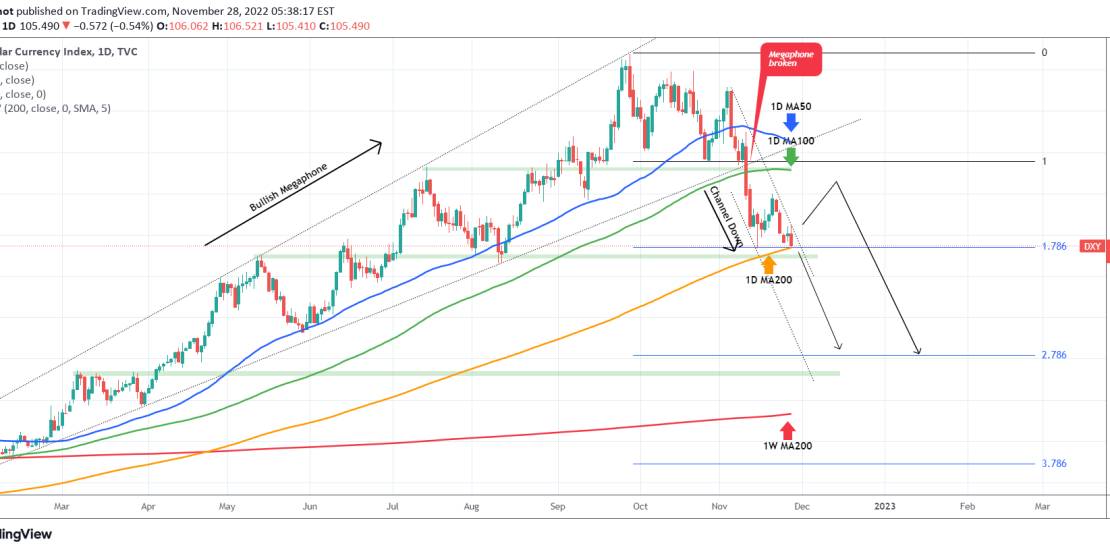
To be exact the last time the U.S. Dollar Index (DXY) hit its 1D MA200 (orange trend-line) was on June 23 2021 and last time it traded below it June 16 2021. Needless to say, this is a key development for the long-term price action, as a candle closing below it, confirms the transition
-
BITCOIN If this level holds, expect 50k on the next rally.
- November 25, 2022
- Posted by: Tradingshot Articles
- Category: Cryptocurrency
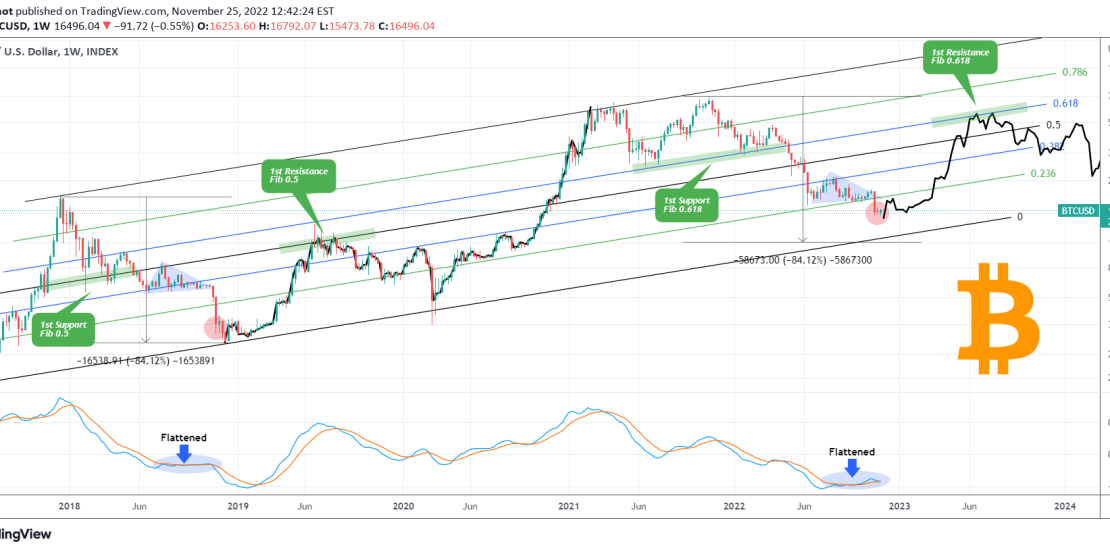
This is an interesting finding on the 1W time-frame, showing Bitcoin (BTCUSD) within a Channel Up since December 2017 High (of the previous Cycle). Below we analyze frame by frame the similarities and differences, key pressure levels and how those can make a projection for the following months. ** Triangle.. then flush ** A
