

- December 2, 2022
- Posted by: Tradingshot Articles
- Category: Stocks
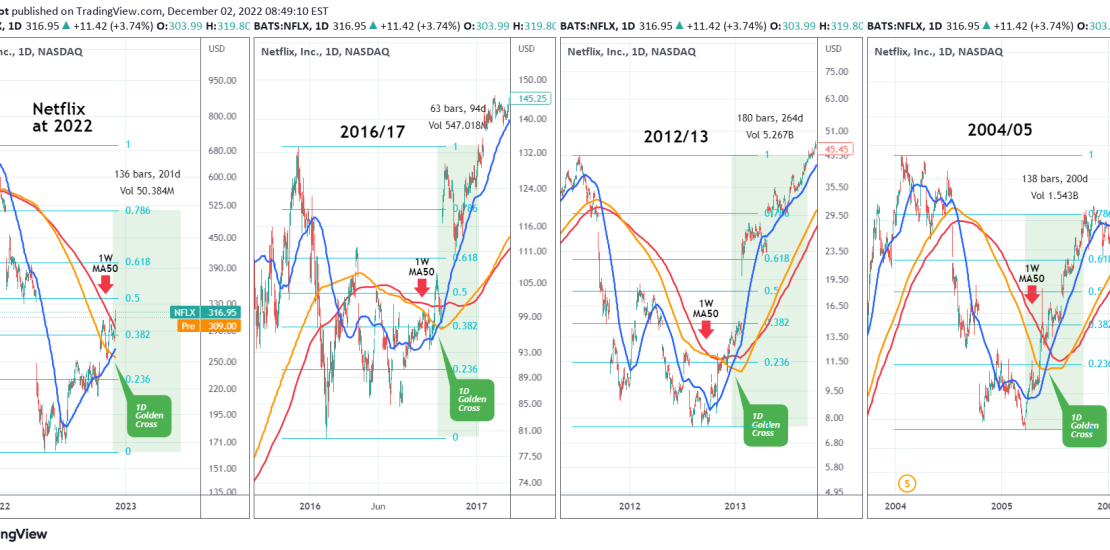
Netflix (NFLX) completed last week the Golden Cross pattern on the 1D time-frame, which is when the 1D MA50 (blue trend-line) crosses above the 1D MA200 (orange trend-line). By doing so it closed yesterday above the 1W MA50 (red trend-line) for the first time since January 06 2022, practically when its Bear Market was confirmed.
Since it started trading, NFLX has had a 1D Golden Cross pattern while below the 1W MA50 another three times (October 07 2016, December 17 2012 and June 02 2005). On all cases, the price recovered at least the 0.786 Fibonacci, very fast. During 2016/17 it recovered the previous High in just 94 days since the 1D Golden Cross formation. In 2012/13 it recovered the previous high in 264 days, while in 2004/05 it recovered the 0.786 Fib in 200 days.
The worst case scenario of 2004/05 would have Netflix hit $511 by June 08 2023. Do you agree? Which of the 3 scenarios do you think is more likely to happen?
Tradingview link: