

- December 1, 2022
- Posted by: Tradingshot Articles
- Category: Stock Indices
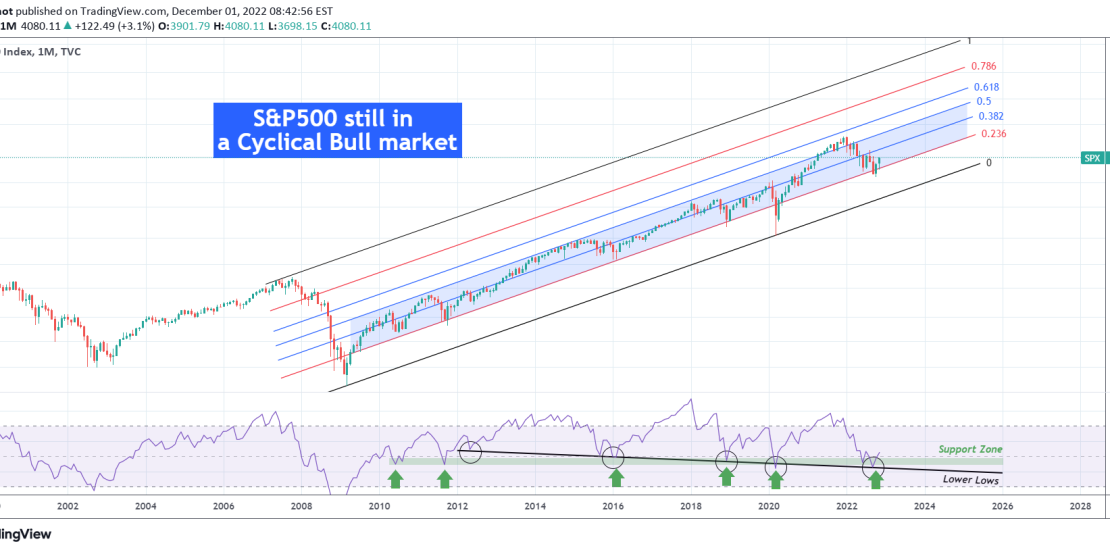
This is the S&P500 index (SPX) on the 1M (monthly) time-frame illustrating key levels and zones using the Fibonacci Channel.
We focus on the price action and pattern created following the last major crisis, the 2008 housing crash. As you see, since that Bear Cycle correction, S&P500 has been trading within a steady Channel Up and with the use of the Fibonacci retracement levels, we see that the price action has been concentrated almost entirely within the 0.236 – 0.5 Fib Zone. The January market top was above it and made the index strongly correct back into the Zone. In September the price broke below the 0.236 Fib for the first time since May 2020 and the COVID crash and buying demand seems to have kicked in almost immediately as the index is up more than +16%.
As a reference, we would like to compare this Channel Up to the one after the 1974 bottom:
As you see on the chart above, it was again the 0.236 – 0.5 Fib Zone that dominated the majority of the price action since the 1974 bottom and the August 1987 top that hit and got rejected at the top of the Channel (Fib 1.0) was what led to the October 1987 mega flash crash of ‘Black Monday’. Then the index continued rising within the upper Fib Zone of 0.618 – 1.0 even more tightly within 0.786 – 1.0, until it eventually broke above it again in June 1995 in the sequence that led and accelerated the Dotcom Bubble of the 90s into the Crash of 2000.
What really helps in identifying the price action’s bottom, hence long-term buy entries, within this post 2009 Channel Up, is the 1M RSI. Since June 2010 it has a Support Zone (green that) was hit and started strong rebounds 6 times (including this September). At the same time, there is an evident Lower Lows trend-line since May 2012 that has had contacts turning into rebounds 5 times.
All the above occurrences combined (price rebounding on the 0.236 Fib, RSI on the Support Zone and Lower Lows trend-line), are a strong bullish mix giving the best buy signal since the March 2020 COVID crash.
And above all, it shows that, at least for the time being, the S&P500 index is still in a Cyclical Bull market and even more so, far from being overbought even on a long-term multi-year scale!
Are you still bearish based on the above?
Tradingview link:
https://www.tradingview.com/chart/SPX/5foNUtCn-S-P500-What-crisis-We-re-still-in-a-cyclical-Bull