

- December 1, 2022
- Posted by: Tradingshot Articles
- Category: Other
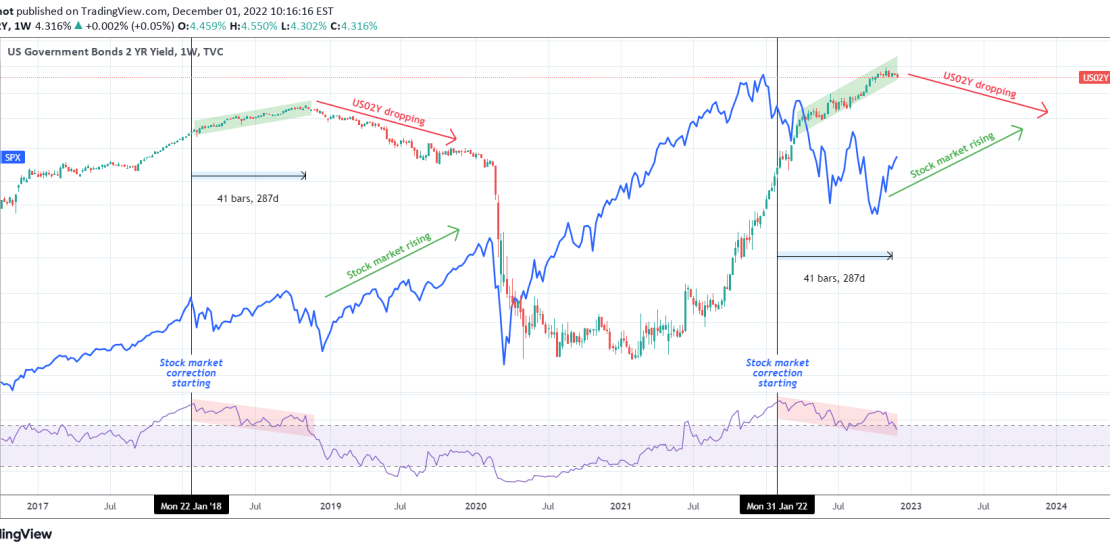
This is a 1W time-frame chart, showing the correlation between the U.S. Government Bonds 2 YR Yield and the S&P500 (blue trend-line). Some may perceive the recent 2-month rally on stocks as a coincidence but the US02Y price action shows that it is not and has a direct correlation with it.
The 1W RSI on the US02Y has been falling within a Channel Down since the start of February 2022, while at the same time the actual price has been rising within a Channel Up. That is a technical Bearish Divergence. The same Bearish Divergence was last seen from late January 2018 up until the week of November 05 2018. As shown on the chart this lasted 41 weeks (287 days).
The start of this Bearish Divergence happened when the stock market(S&P500) had an initial pull-back event entering into a year long period of volatility, followed buy an even stronger correction. Once the US02Y started to drop, the stock market bottomed and started rising sustainably (until of course the non-technical black Swan event of COVID).
Right now, we are two weeks past the 41 week (287 days) mark and the US02Y has been dropping for 4 weeks. As mentioned, the stock market has been (aggressively) rising since the October 10 2022 1W candle. The fractals are identical and this could be a repeat of the 2019 rally. Whether we see it extending or not, the US20Y certainly holds the key.
Tradingview link: