

2022
-
SHIBUSDT Falling Wedge forming a Bottom
- June 20, 2022
- Posted by: Tradingshot Articles
- Category: Cryptocurrency
No Comments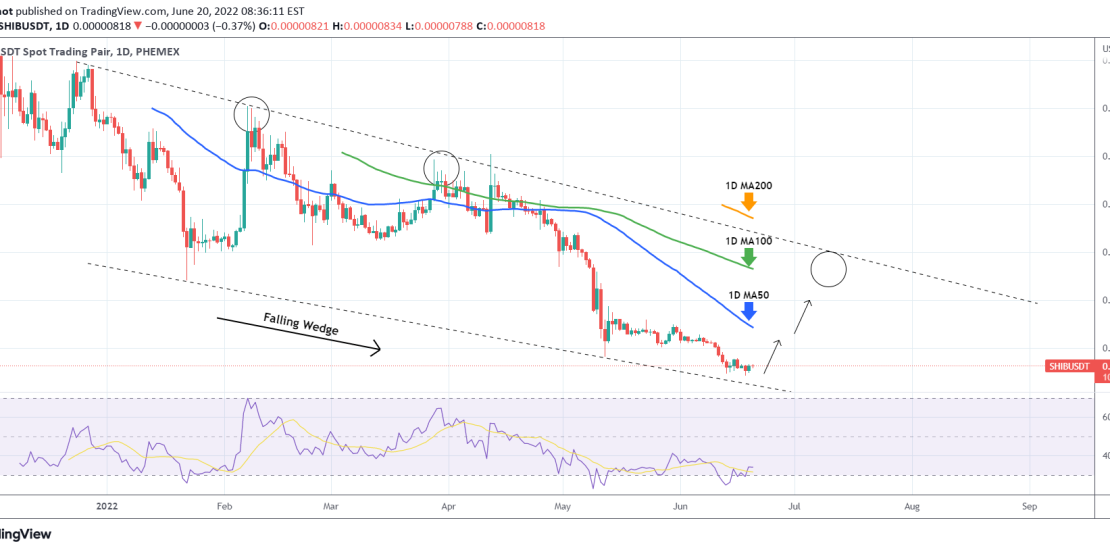
*** *** For this particular analysis on SHIBA we are using the SHIBUSDT symbol on the Phemex exchange. *** *** The idea is on the 1D time-frame where Shiba has been trading within a Falling Wedge pattern since the December 24 2021 High. The price has been trading near the pattern’s Lower Lows trend-line
-
S&P500 Bullish month ahead towards at least the 1D MA50
- June 20, 2022
- Posted by: Tradingshot Articles
- Category: Stock Indices
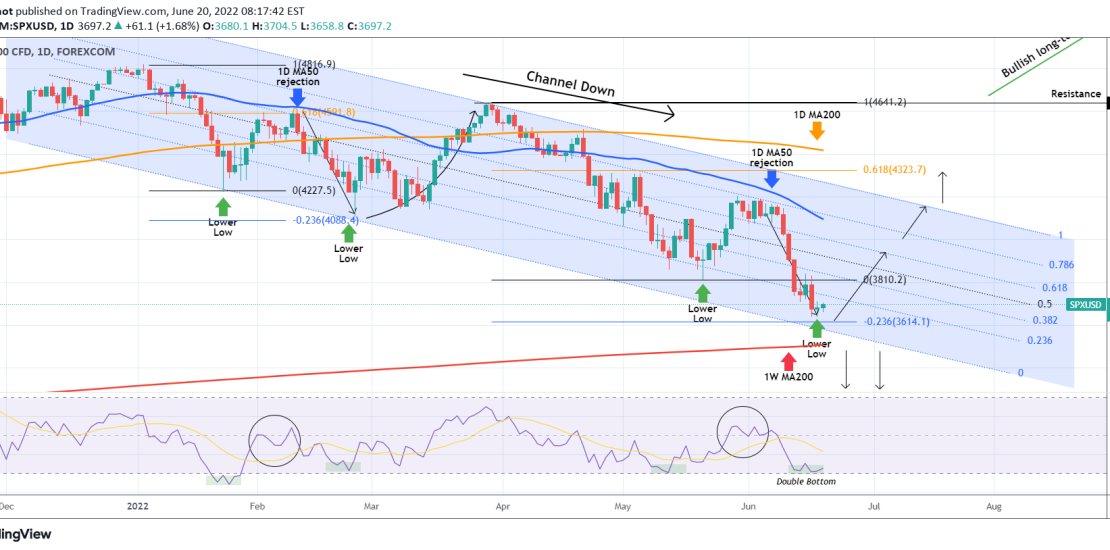
The S&P500 index continues to trade within a long-term Channel Down, providing excellent trade opportunities on its Lower Highs and Lower Lows. Our previous analysis on this symbol was a sell warning as the 1D MA50 (blue trend-line) was resisting: As it turned out, that was the most optimal sell of this phase and
-
NZDCAD Buy upon a pull-back, target the 1D MA200
- June 17, 2022
- Posted by: Tradingshot Articles
- Category: Forex
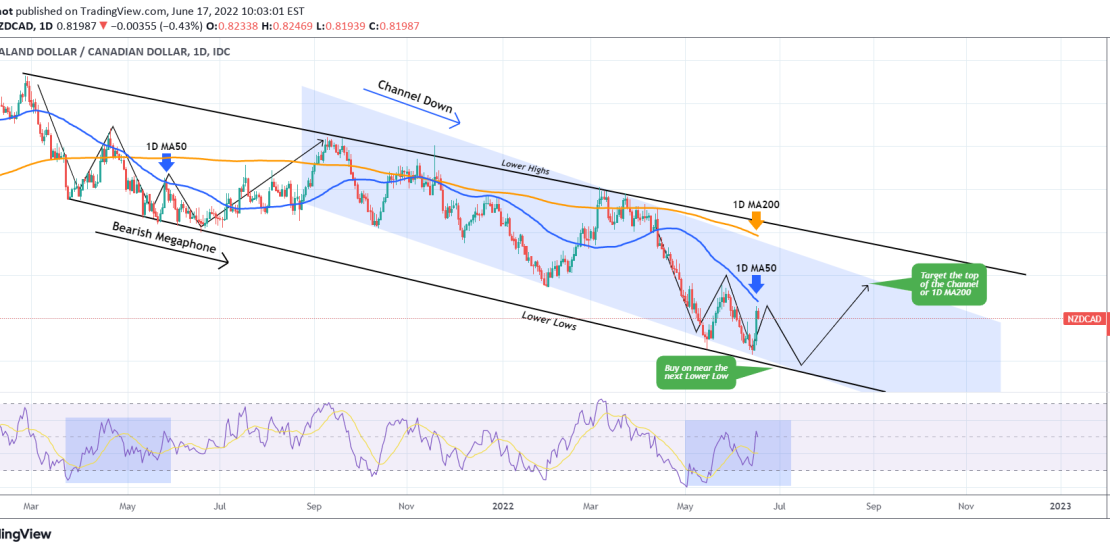
The NZDCAD pair has been trading on a Channel Down within a Bearish Megaphone pattern. Right now the price is testing the 1D MA50 (blue trend-line) as a Resistance and is struggling, trading below it since April 13. Both the 1D RSI and the candle action resembles the sequence at the start of the
-
BITCOIN The Ultimate Support Band. 1W MA300 coming into play?
- June 17, 2022
- Posted by: Tradingshot Articles
- Category: Cryptocurrency
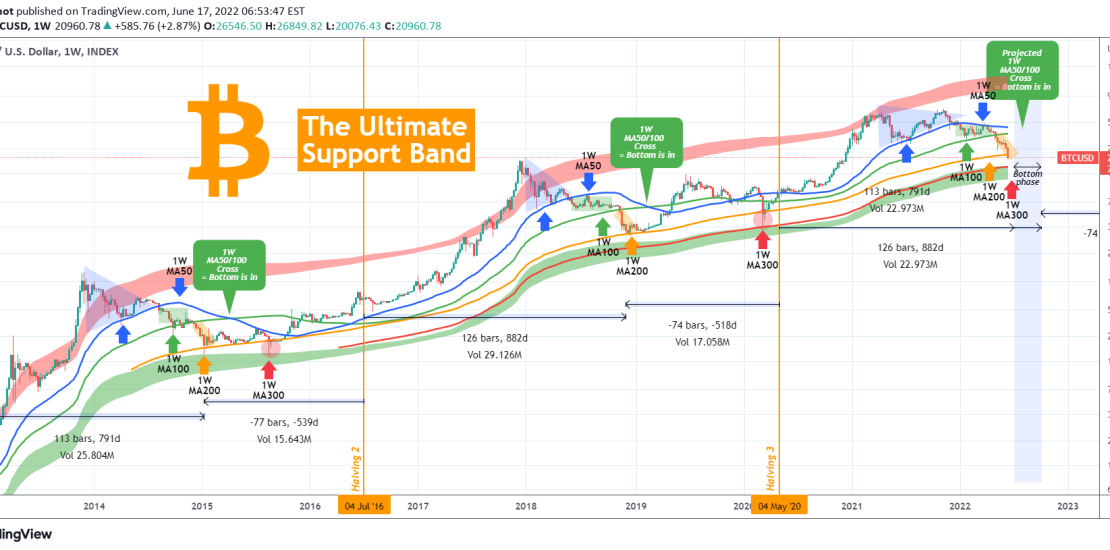
Bitcoin (BTCUSD) is now below its 1W MA200 (orange trend-line) for the first time since the March 2020 COVID crash. As I’ve mentioned numerous times, that has been the trend-line that marked the bottoms on both previous BTC Bear Cycles (all candles closed above). On this analysis, I am extending my previous publications on
-
ETHUSD On the lowest 1W RSI ever testing the Growth Curve!
- June 17, 2022
- Posted by: Tradingshot Articles
- Category: Cryptocurrency
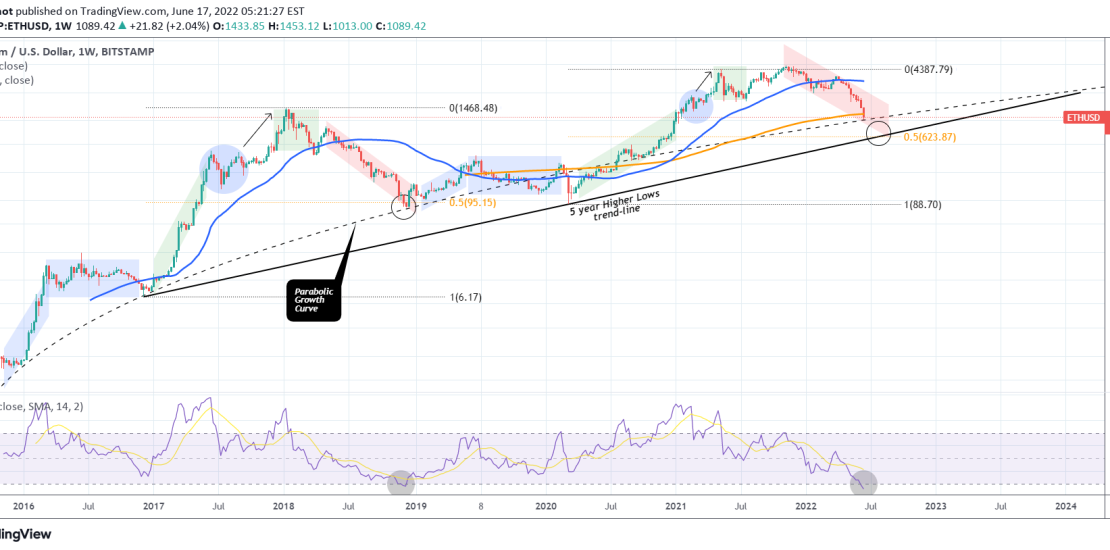
Ethereum (ETHUSD) broke this week (chart on 1W time-frame) below its 1W MA200 (orange trend-line) for the first time since October 2020. The 1W RSI hit the lowest level ever recorded in ETH’s history and by doing so, the price hit its Logarithmic Growth Curve (dashed line). All this paint the picture of a
-
DOW JONES Critical Channel bottom test.
- June 16, 2022
- Posted by: Tradingshot Articles
- Category: Stock Indices
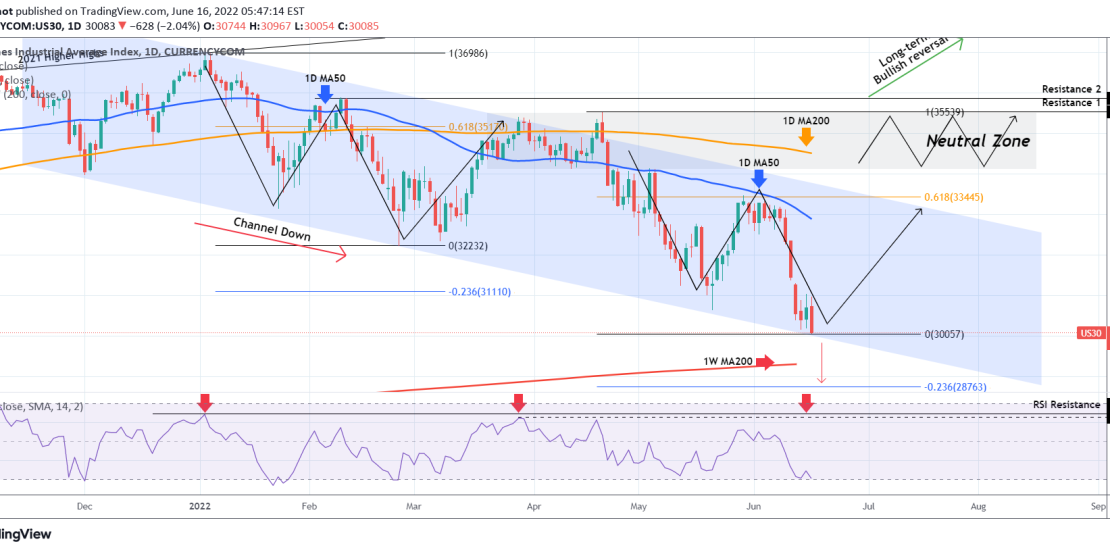
Dow Jones (DJI) has been trading within a Channel Down since its All Time High on January 04 2022. It is the very same Channel on which we based the accurate sell call 10 days ago as the price failed to break above the 1D MA50 (blue trend-line) for more than a week: Right
-
NASDAQ preparing a mid-March rebound with eyes on the 1W MA200
- June 16, 2022
- Posted by: Tradingshot Articles
- Category: Stock Indices
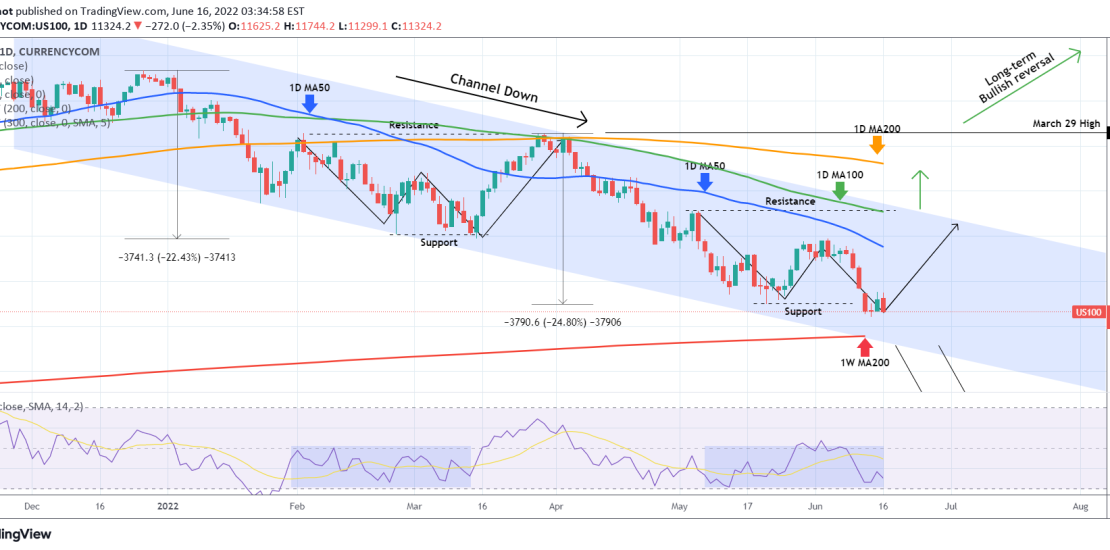
Our last analysis on Nasdaq (NDX) 10 days ago, came with a warning that as long as the 1D MA100 (green trend-line) and the Lower Highs trend-line of the long-term Channel Down held, the trend was bearish towards the 11500 Support: As you see the 11500 target was eventually hit, and with the Fed
-
EURNZD Sell opportunity
- June 16, 2022
- Posted by: Tradingshot Articles
- Category: Forex
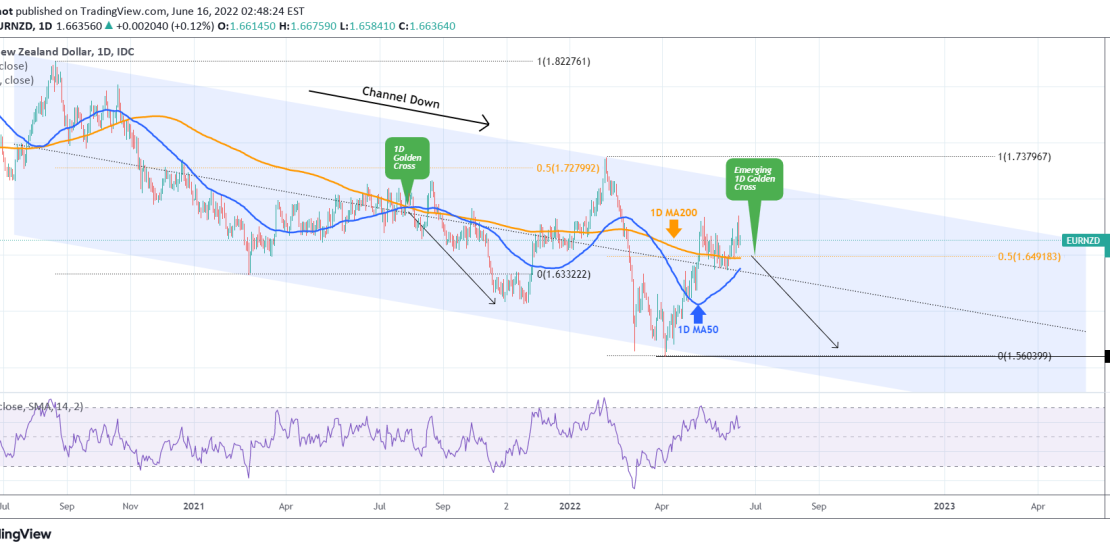
The EURNZD pair eventually entered its bullish zone as outlined by our last analysis in April: The price is now high enough within the Channel Down to justify a medium-term sell as not only did it come too close to the Lower Highs (top) trend-line but the 1D RSI is on Lower Highs after
-
EURAUD going for the 1D MA200 test
- June 15, 2022
- Posted by: Tradingshot Articles
- Category: Forex
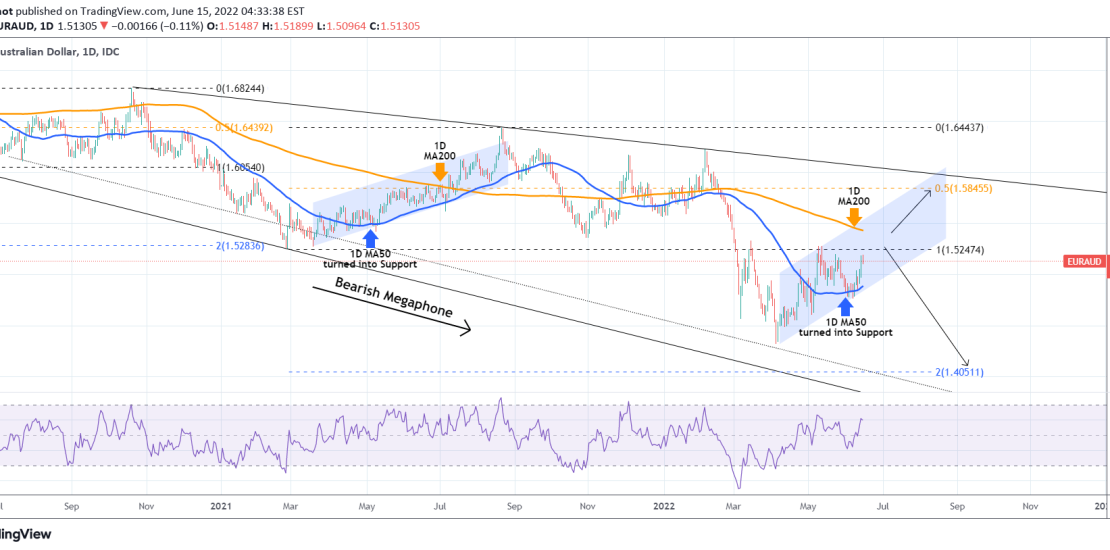
The EURAUD pair has been trading within a long-term Bearish Megaphone pattern but since the April 05 bottom, it has established a Channel Up on the medium-term. A similar Channel Up pattern was what took the Megaphone to its previous Lower High. In the process, the 1D MA50 (blue trend-line) has been turned into
-
GBPAUD Trading according to plan
- June 14, 2022
- Posted by: Tradingshot Articles
- Category: Forex
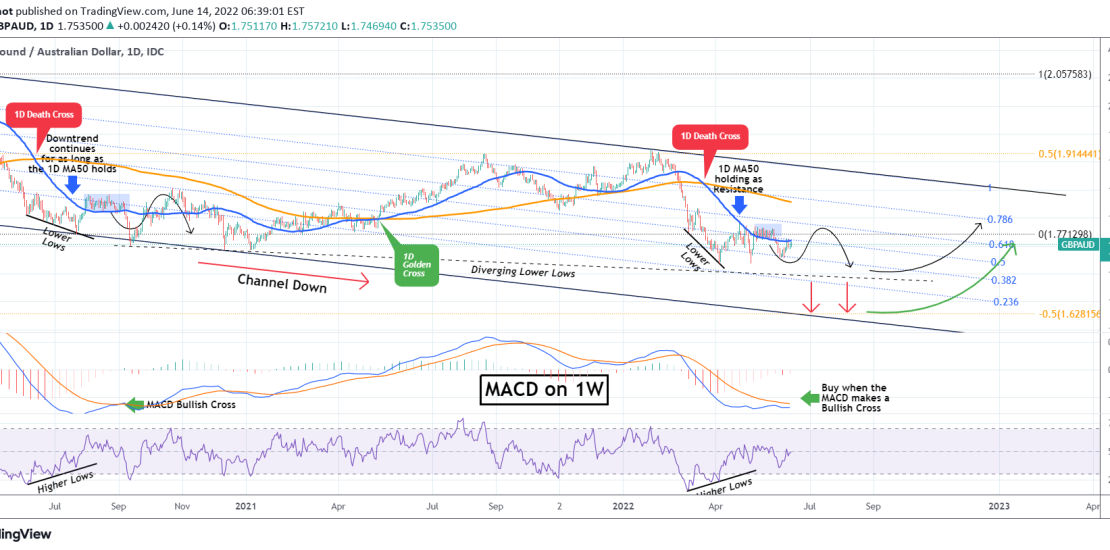
There isn’t much to update on the GBPAUD pair, as since our last analysis on April 21, the price has been following our plan in a very precise way: As you see, the similarities with the July – October 2020 sequence have paid off and the price action continues to follow that pattern. We