

- June 17, 2022
- Posted by: Tradingshot Articles
- Category: Cryptocurrency
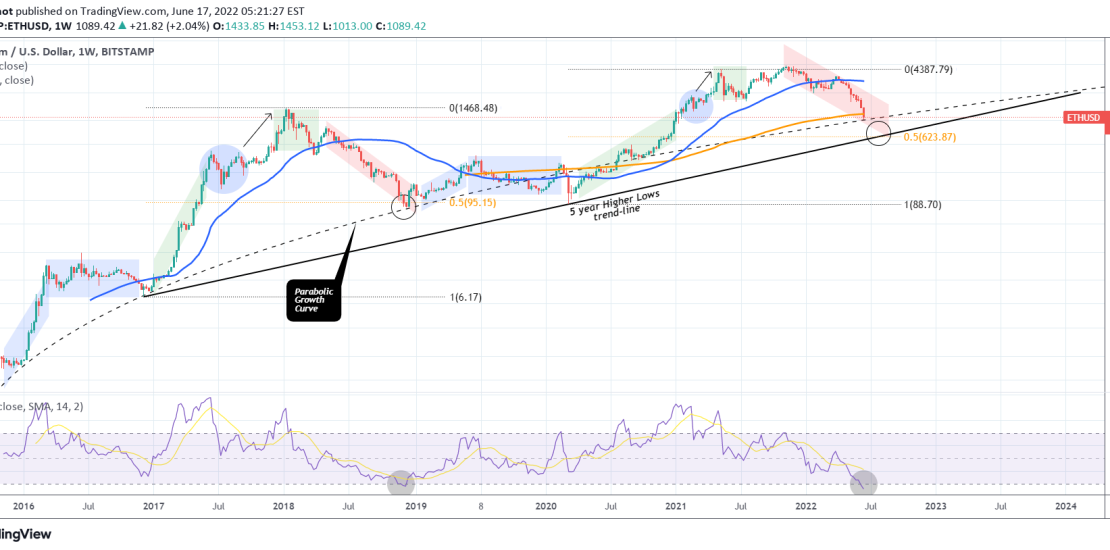
Ethereum (ETHUSD) broke this week (chart on 1W time-frame) below its 1W MA200 (orange trend-line) for the first time since October 2020. The 1W RSI hit the lowest level ever recorded in ETH’s history and by doing so, the price hit its Logarithmic Growth Curve (dashed line).
All this paint the picture of a strong Support Zone. However, there is a certain condition from Ethereum’s last Bear Cycle that hasn’t yet been fulfilled and that is touching the 0.5 Fibonacci retracement level from the moment the Parabolic Rally (green Channel Up) started. In December 2018 that was where the Bottom was formed. That parameter is now around $625. Interestingly enough it is exactly where the 5 year Higher Lows trend-line is. If the Growth Curve breaks, it is very likely to see the final bottom there.
Do you think the historically oversold 1W RSI is enough to accumulate buyers and prevent this?
Tradingview link: