

- June 20, 2022
- Posted by: Tradingshot Articles
- Category: Cryptocurrency
*** ***
For this particular analysis on SHIBA we are using the SHIBUSDT symbol on the Phemex exchange.
*** ***
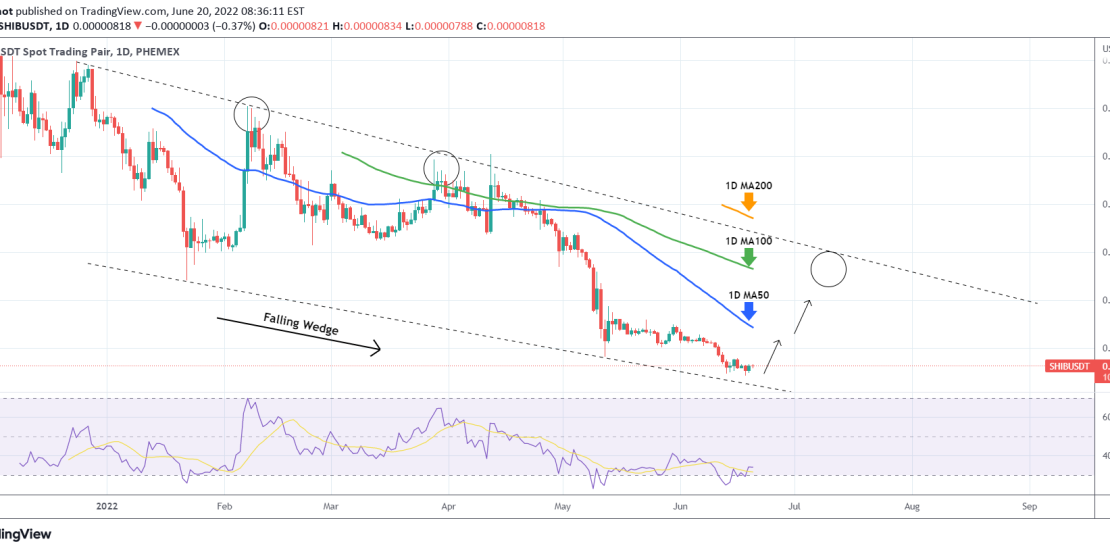
The idea is on the 1D time-frame where Shiba has been trading within a Falling Wedge pattern since the December 24 2021 High. The price has been trading near the pattern’s Lower Lows trend-line since the May 12 Lower Low, being unable to stage a sustainable rebound. The longer it trades near that level, the more likely it is to attract buyers and form a bottom.
The immediate target is always the 1D MA50 (blue trend-line) and a closing above it takes us to the medium-term 1D MA100 (green trend-line). Only a break above the 1D MA200 (orange trend-line) can justify further buying, in which case we’ll have a long-term bullish reversal into a new Bull Cycle.
Tradingview link:
https://www.tradingview.com/chart/SHIBUSDT/vg6NPyzB-SHIBUSDT-Falling-Wedge-forming-a-Bottom