2022 August
-
LDOUSDT Repeating April’s bearish fractal unless this breaks.
- August 31, 2022
- Posted by: Tradingshot Articles
- Category: Cryptocurrency
No Comments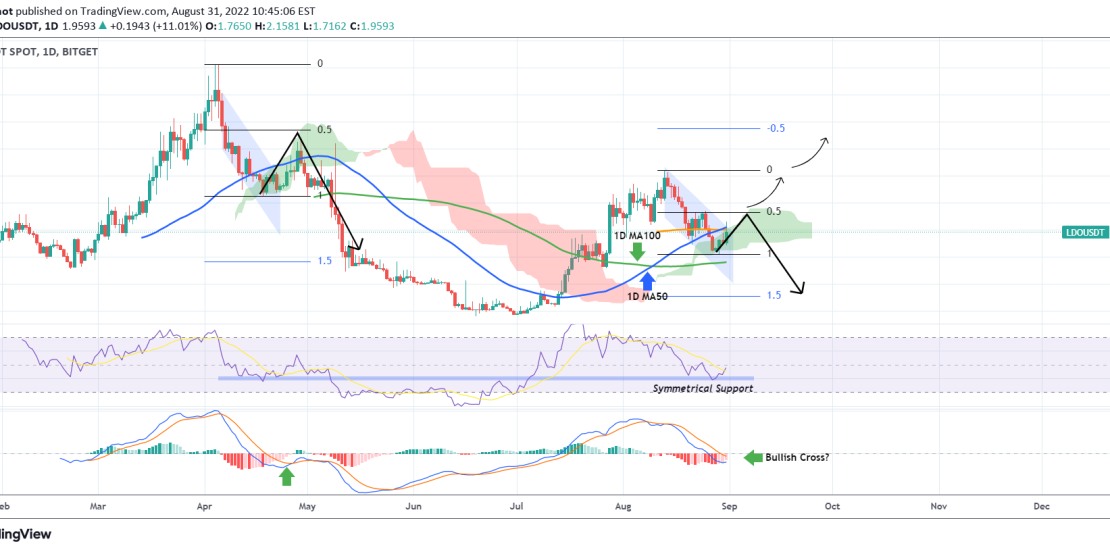
LIDO DAO (LDOUSDT) broke above its 1D MA50 (blue trend-line) today as so far the correction since the August 13 High was contained inside the green Ichimoku Cloud. This isn’t yet the time to be bullish, as the same Cloud provided support from April 18 to April 28 and despite breaking again above the
-
VISA About to start a historic Bull Cycle similar to post 2009
- August 30, 2022
- Posted by: Tradingshot Articles
- Category: Stocks
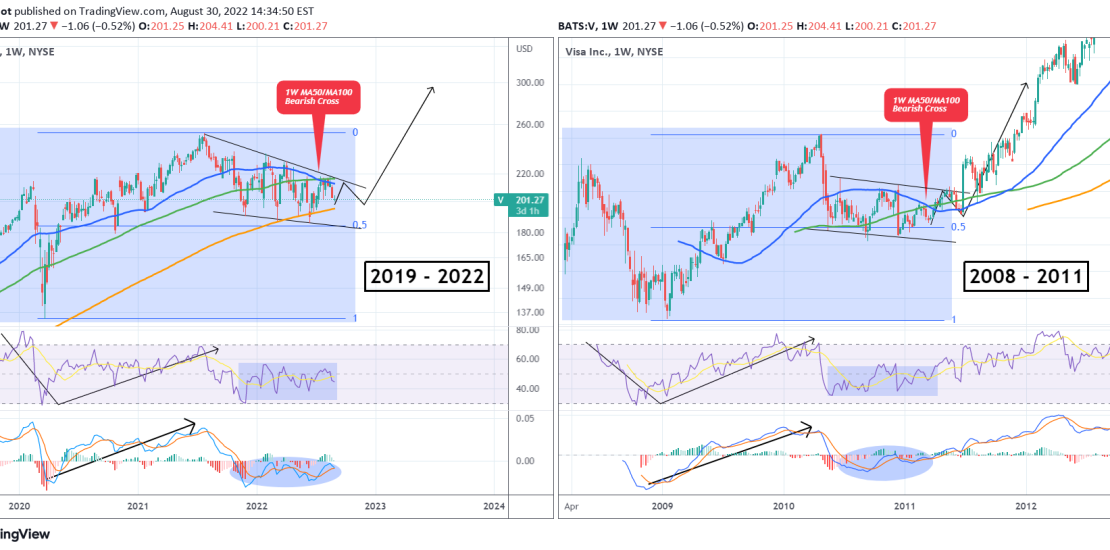
This is Visa Inc. (V) on the 1W time-frame. The primary pattern since the July 26 2021 All Time High (ATH) has been a Falling Wedge and the price continues to hold that formation after being rejected on the August 15 candle on the Lower Highs (top) trend-line. With the 1W MA50 (blue trend-line)
-
EURUSD Short-term rebound to 1D MA50 possible ahead of the NFP
- August 30, 2022
- Posted by: Tradingshot Articles
- Category: Forex
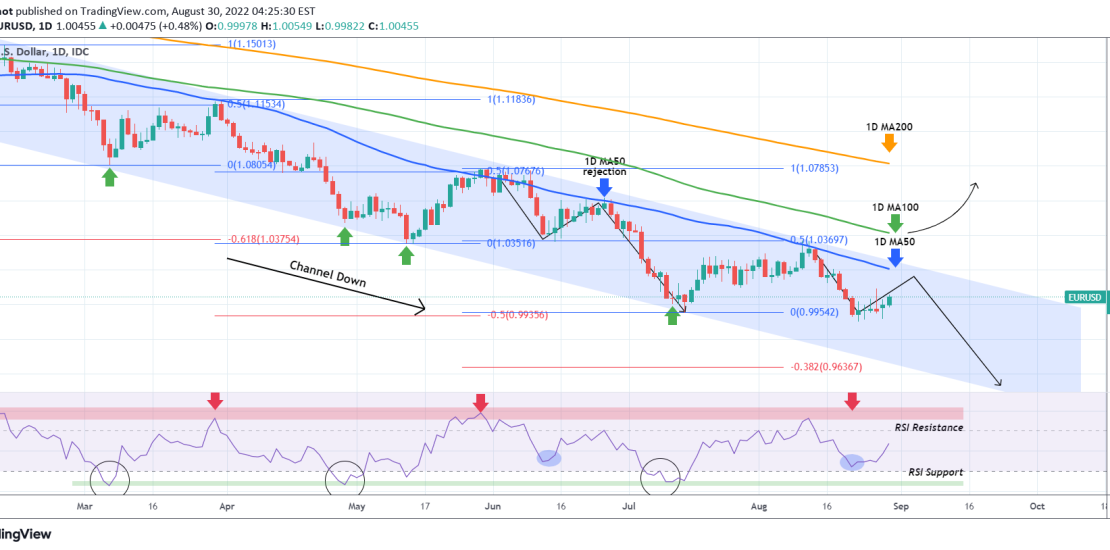
The EURUSD pair has entered the U.S. Nonfarm Payrolls (NFP) week scheduled for this Friday with some stabilization bias. It appears that the price is respecting the August 23 Low as the new short-term Support, which along with the July 14 Low being that close, make a solid Zone. With the 1D RSI rebounding
-
USDJPY is close to making a long-term top
- August 29, 2022
- Posted by: Tradingshot Articles
- Category: Forex
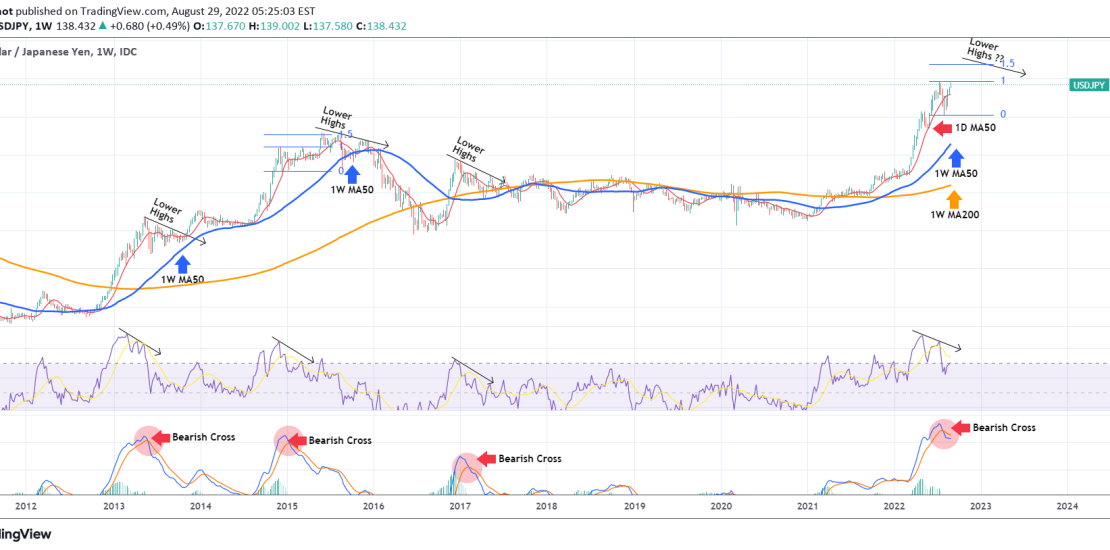
The USDJPY pair has been on a very aggressive (turned into parabolic) rise since the 2021 Low. It has been above the 1W MA50 (blue trend-line) and the 1W MA200 (orange trend-line) for the whole year. In the past 30 days it broke below the 1D MA50 (red trend-line) but recovered all the losses
-
S&P500 got rejected as expected. Now testing the first Support.
- August 29, 2022
- Posted by: Tradingshot Articles
- Category: Stock Indices
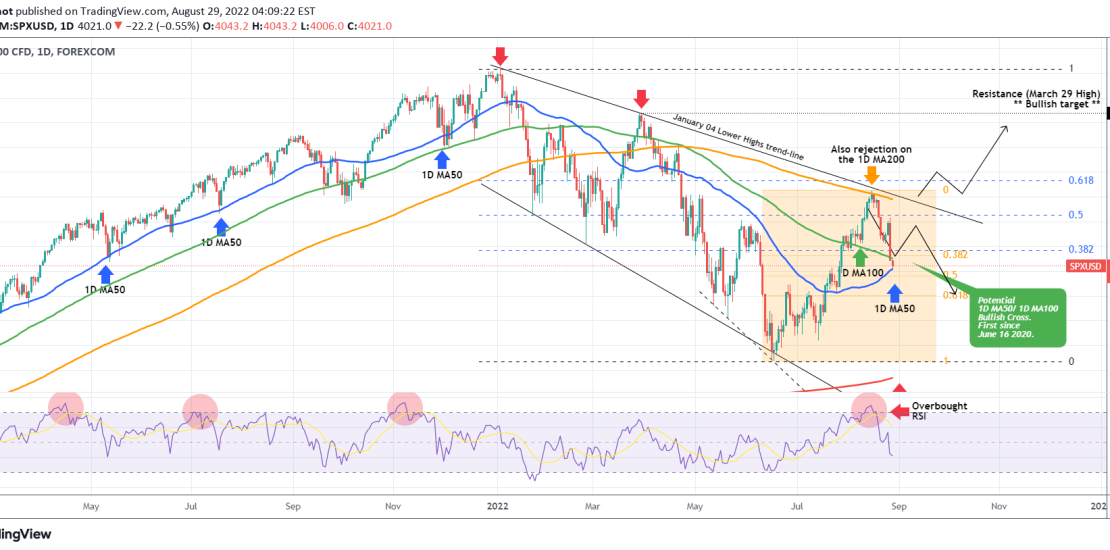
The S&P500 index (SPX) had a strong rejection on the 1D MA200 (orange trend-line), which we caught on the exact spot with our trading idea below 10 days ago: The timing on this projection couldn’t have been better, with early signs of a possible pull-back obvious as the Overbought 1D RSI has always been
-
NZDCAD 1D MA50 is the key. Sell below, buy above.
- August 26, 2022
- Posted by: Tradingshot Articles
- Category: Forex
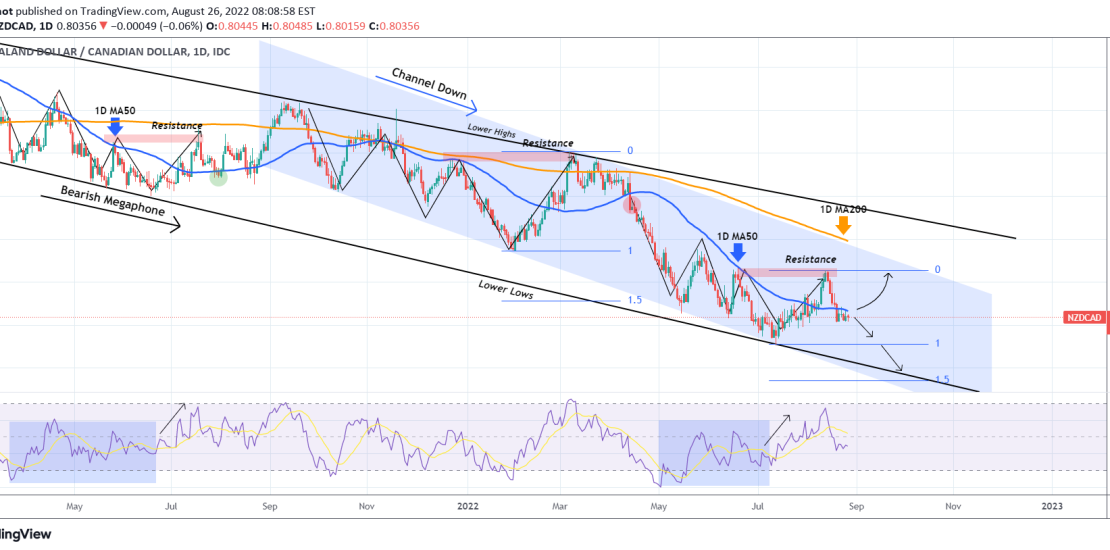
The NZDCAD pair has offered us an excellent pattern for a sell high/ buy low plan on our previous analysis more than two months ago: As you see, we were successful on the sell exactly on the 1D MA50 (blue trend-line) rejection and the buy on the Lower Lows trend-line of both the Megaphone
-
GBPNZD Excellent buy level for a rally to the end of the year
- August 26, 2022
- Posted by: Tradingshot Articles
- Category: Forex
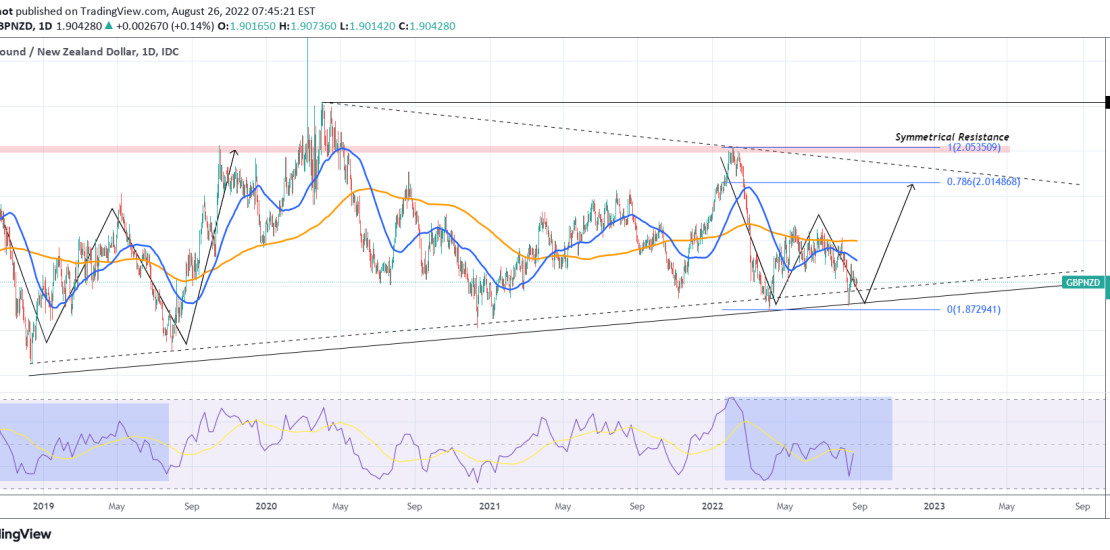
The GBPNZD pair has been following exactly our trading plan since our last update a month ago, getting rejected on the 1D MA200 (orange trend-line) and hitting the Higher Lows zone of the long-term Triangle pattern that it has been trading in since the April 02 2020 High: The initial rebound after the August
-
DXY critical test on the multi-year pivot. Huge sell ahead?
- August 26, 2022
- Posted by: Tradingshot Articles
- Category: Forex
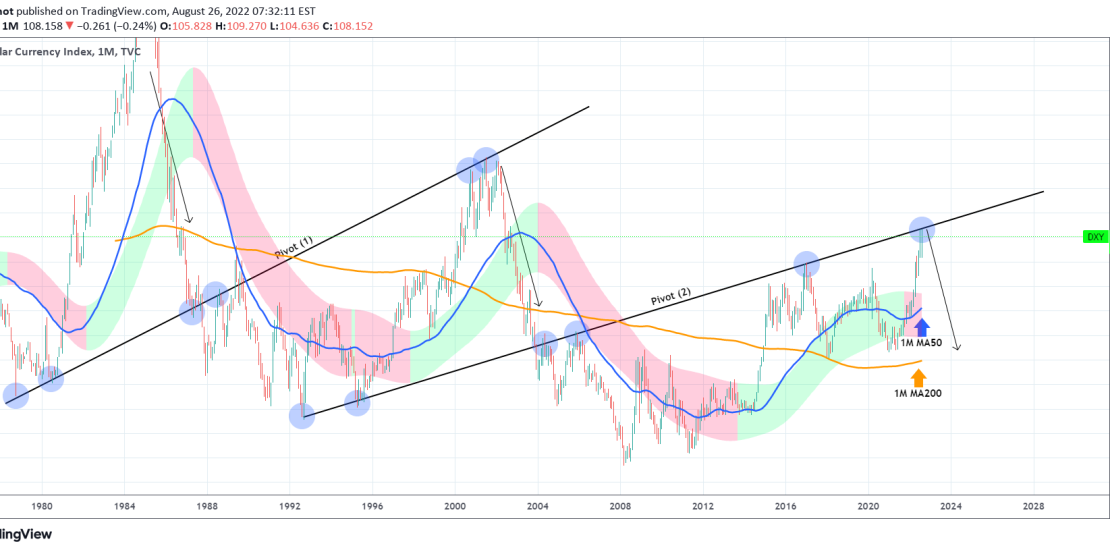
The U.S. Dollar Index (DXY) hit last month a Pivot trend-line (2) and so far is unable to break it. This pivot has started as a Support back in August 1992 and then turned into a Resistance since May 2004 and has been such up to this date. As you see, the very same
-
S&P500 All time High trend-line is rejecting the uptrend!
- August 19, 2022
- Posted by: Tradingshot Articles
- Category: Stock Indices
The S&P500 index (SPX) hit 3 days ago the 1D MA200 (orange trend-line) and got rejected. But perhaps an even more important development than that is the fact that this rejection also took place on the January 04 Lower Highs trend-line, practically the Resistance trend-line that started from the All Time High (ATH). We’ve
-
EURUSD heavy rejection on the 1D MA50 yet again
- August 15, 2022
- Posted by: Tradingshot Articles
- Category: Forex
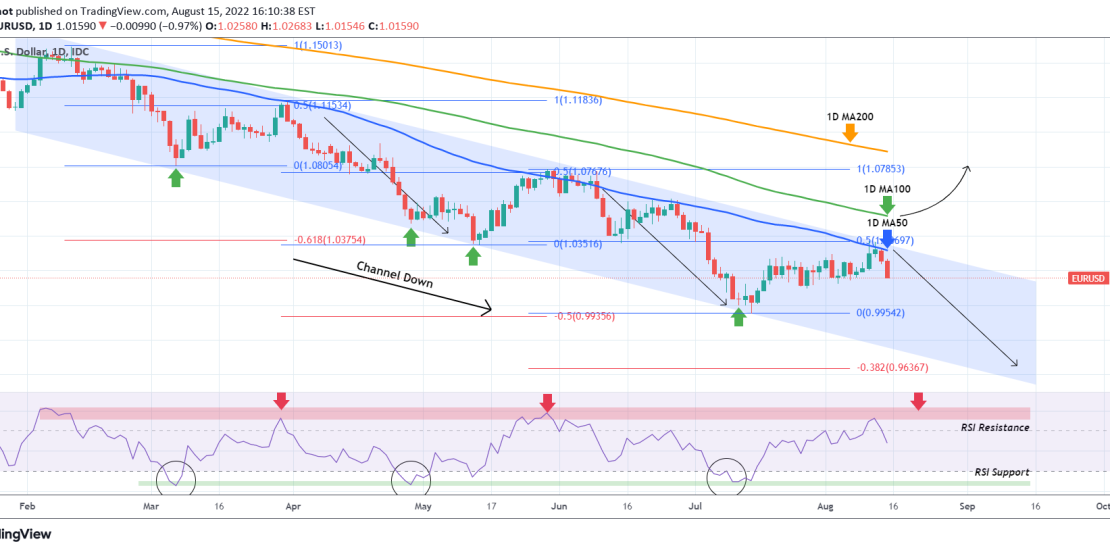
The EURUSD pair got rejected again on its 1D MA50 (blue trend-line) and the 0.5 Fibonacci retracement level yet again. This is the 3rd time that this sequence is being repeated within the Channel Down pattern that started following the February 10 high. We’ve outlined this potential in our last EURUSD analysis last week:
- 1
- 2

