

- August 29, 2022
- Posted by: Tradingshot Articles
- Category: Forex
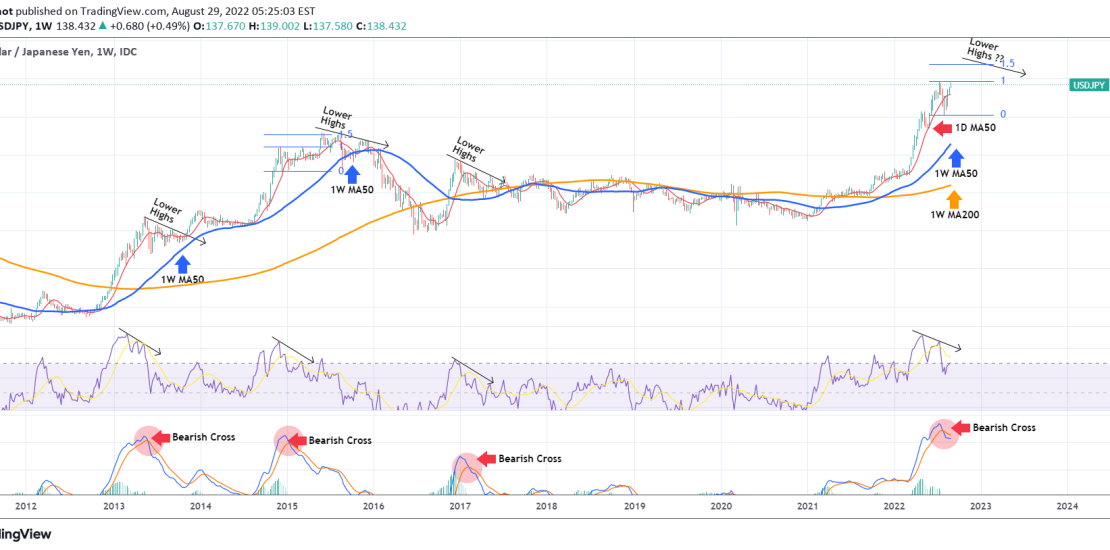
The USDJPY pair has been on a very aggressive (turned into parabolic) rise since the 2021 Low. It has been above the 1W MA50 (blue trend-line) and the 1W MA200 (orange trend-line) for the whole year. In the past 30 days it broke below the 1D MA50 (red trend-line) but recovered all the losses quickly and is testing the July High.
On this 1W time-frame, the RSI has been on Lower Highs since May 02 and the MACD on a Bearish Cross since July 25. We have seen those formations taking place at the exact same order another 3 times since March 2013.
As you see on the chart, that created at least a Triangle and high volatility that reached (or traded very close to) the 1W MA50. In June 2015, the eventual peak took place a little after those formations, on the 1.5 Fibonacci extension. What this shows though that short-term traders can at least sell towards the 1D MA50 and use it as a pivot and long-term traders average sell positions, targeting the 1S MA50.
Tradingview link:
https://www.tradingview.com/chart/USDJPY/aNwKL0Zl-USDJPY-is-close-to-making-a-long-term-top