

- August 26, 2022
- Posted by: Tradingshot Articles
- Category: Forex
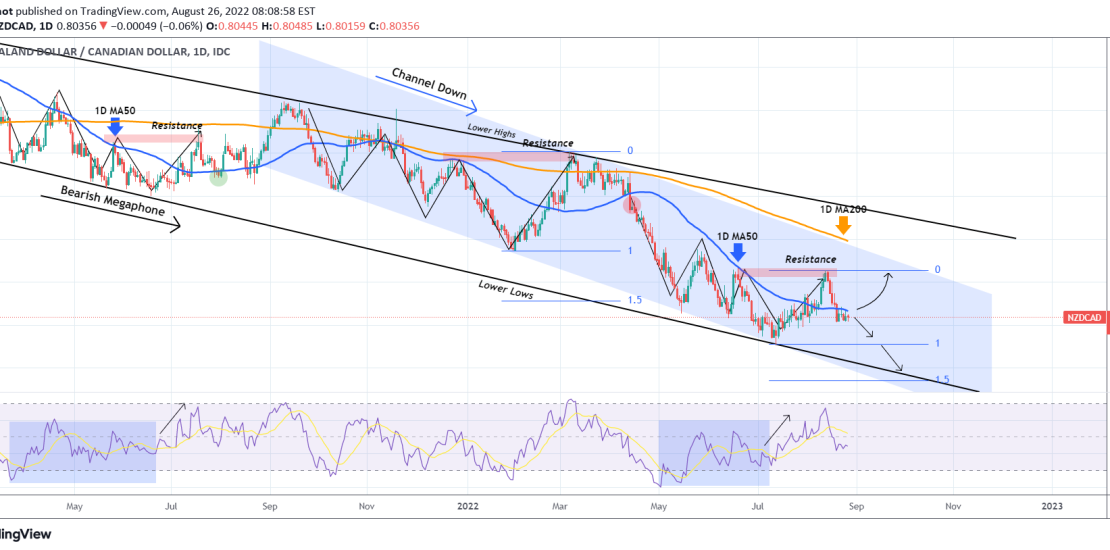
The NZDCAD pair has offered us an excellent pattern for a sell high/ buy low plan on our previous analysis more than two months ago:

As you see, we were successful on the sell exactly on the 1D MA50 (blue trend-line) rejection and the buy on the Lower Lows trend-line of both the Megaphone and Channel Down patterns.
Right now there is a conflict as to where we could be in relation to the prior formations. This may be a quick accumulation below the 1D MA50 similar to July 30 2021 (green circle) or a failure below the 1D MA50 similar to April 15 2022.
The 1D MA50 can give the solution to this. As long as 1D candles close below it, the action is a sell targeting first the 0.79100 Support and the 1.5 Fibonacci extension (0.7745) as part of a new Lower Low formation. A closing above the 1D MA50 though, should be taken as a bullish signal, targeting the 0.8250 Resistance and potentially the 1D MA200 (orange trend-line).
Tradingview link:
https://www.tradingview.com/chart/NZDCAD/Xi6yx2mM-NZDCAD-1D-MA50-is-the-key-Sell-below-buy-above