

- August 26, 2022
- Posted by: Tradingshot Articles
- Category: Forex
No Comments
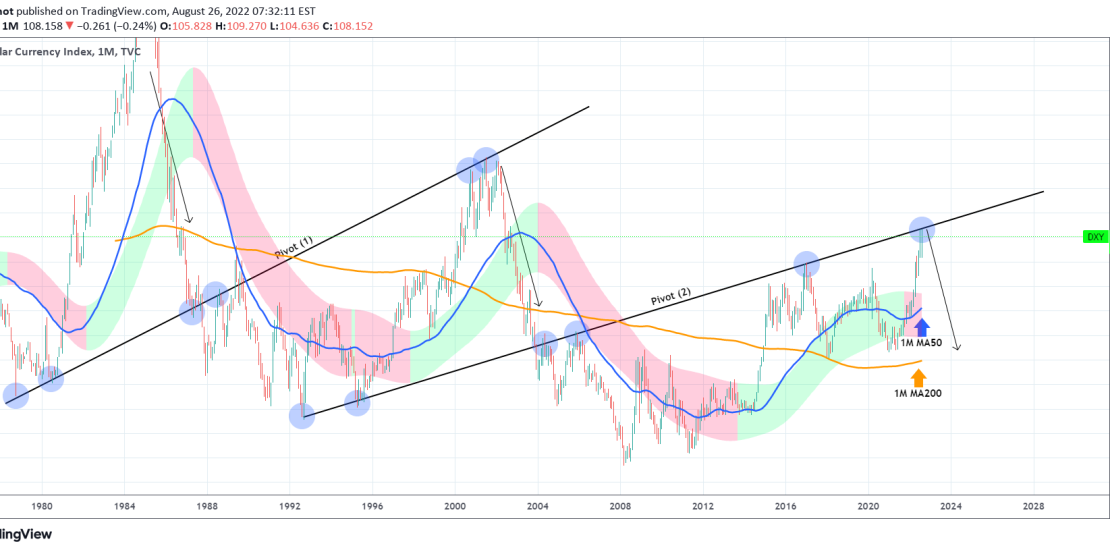
The U.S. Dollar Index (DXY) hit last month a Pivot trend-line (2) and so far is unable to break it. This pivot has started as a Support back in August 1992 and then turned into a Resistance since May 2004 and has been such up to this date.
As you see, the very same pattern with a Pivot trend-line (1), had a similar effect on the multi-year trend from October 1978 to June 2001, which seems to be a similar point to where we are at today.
See how every such rejection on the Pivot as a Resistance has been brutal and the sell-off have been very quick and strong. If that is the case this time too, we should be expecting now a rejection and a massive pull-back to the 1W MA200 (orange trend-line) at least, within 2023.
Tradingview link: