

- August 30, 2022
- Posted by: Tradingshot Articles
- Category: Stocks
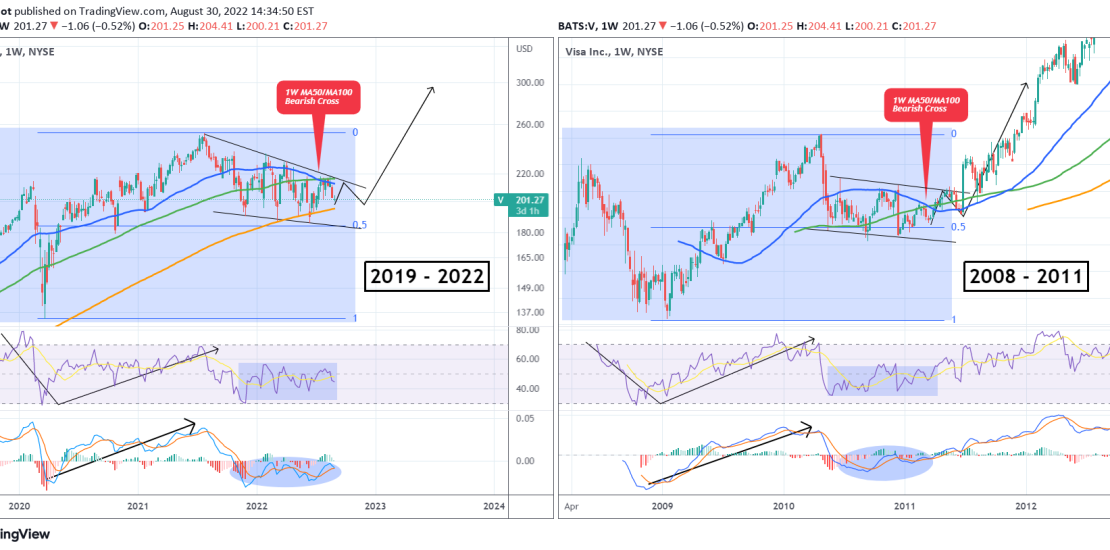
This is Visa Inc. (V) on the 1W time-frame. The primary pattern since the July 26 2021 All Time High (ATH) has been a Falling Wedge and the price continues to hold that formation after being rejected on the August 15 candle on the Lower Highs (top) trend-line. With the 1W MA50 (blue trend-line) crossing below the 1D MA100 (green trend-line), the first Bearish Cross since March 14 2011 has been formed!
In fact that Bearish Cross capped off a similar trading pattern to that Visa has been trading in since mid 2019. This idea compared the two eras: 2019 – 2022 and 2008 – 2011.
In 2011, the stock was trading within a Channel Down as the accumulation pattern instead of a Falling Wedge, with its Lows contained around the 0.5 Fibonacci retracement level. Following the Bearish Cross and the pull-back that came with it, the price made one last Lower High, pulled-back and then broke above the pattern aggressively. If the same formation continues to be repeated then we can have a break above the Falling Wedge by December/ January. See also how the RSI and MACD patterns are similar.
Tradingview link: