

2022 August
-
DAX broke above the 1D MA100. Important Lower High test.
- August 12, 2022
- Posted by: Tradingshot Articles
- Category: Stock Indices
No Comments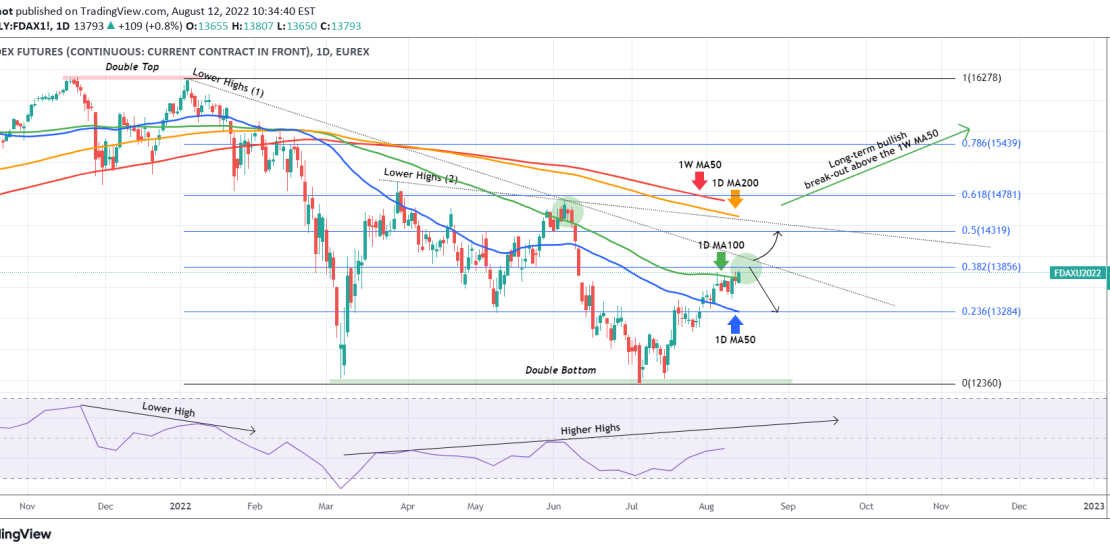
The German Index DAX (FDAX) is attempting today a 1D candle closing above the 1D MA100 (green trend-line) and if successful it will be the first since June 07. Despite the bullish short-term action, this is not the time to double down on buying as the January 05 Lower Highs trend-line (1) is right
-
AUDCAD Important 1D MA200 test. Low risk trades around it.
- August 12, 2022
- Posted by: Tradingshot Articles
- Category: Forex
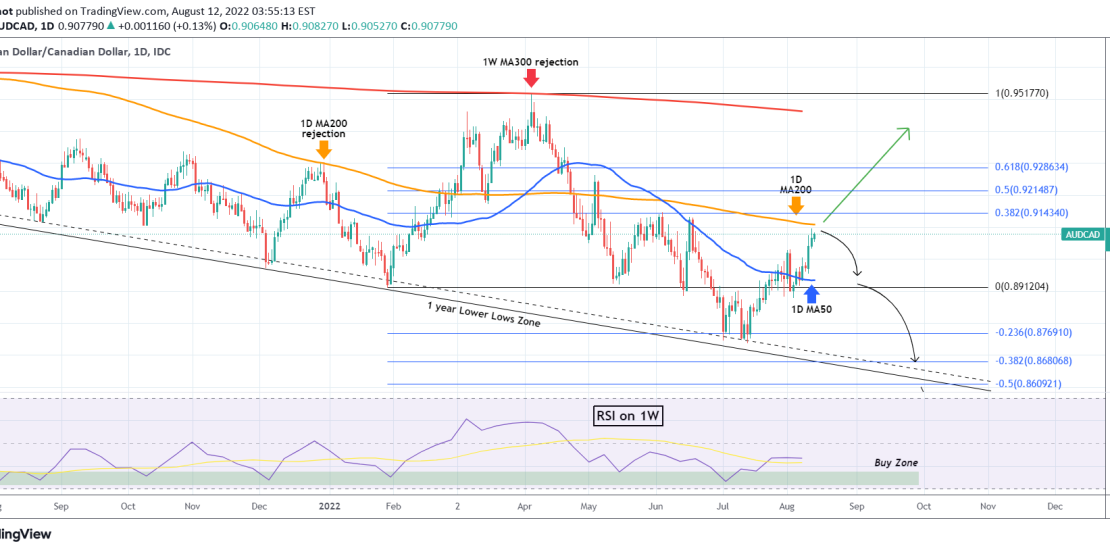
The AUDCAD pair has been on a strong rise since the July 13 Low on the 1 year Lower Lows zone. That was a buy signal that we posted exactly a month ago: The rebound has now reached the critical 1D MA200 (orange trend-line), which has been the Resistance in the past 3 months.
-
NASDAQ testing the most important long-term Resistance cluster.
- August 11, 2022
- Posted by: Tradingshot Articles
- Category: Stock Indices
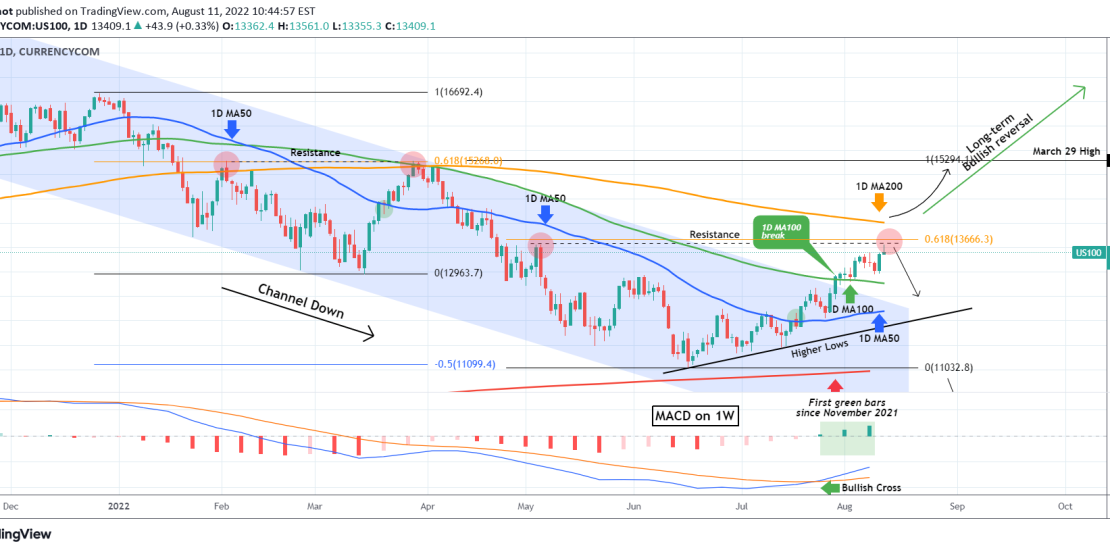
This is an update to last week’s analysis as Nasdaq (NDX) is finally putting the long-term Resistance cluster to test. That consists of the May 05 High (13600), the 0.618 Fibonacci retracement level (13666) and the 1D MA200 (orange trend-line), which has been intact since April 05. Basically the whole Lower Low – Lower
-
EURJPY keeps following our plan. Strong buy ahead.
- August 9, 2022
- Posted by: Tradingshot Articles
- Category: Forex
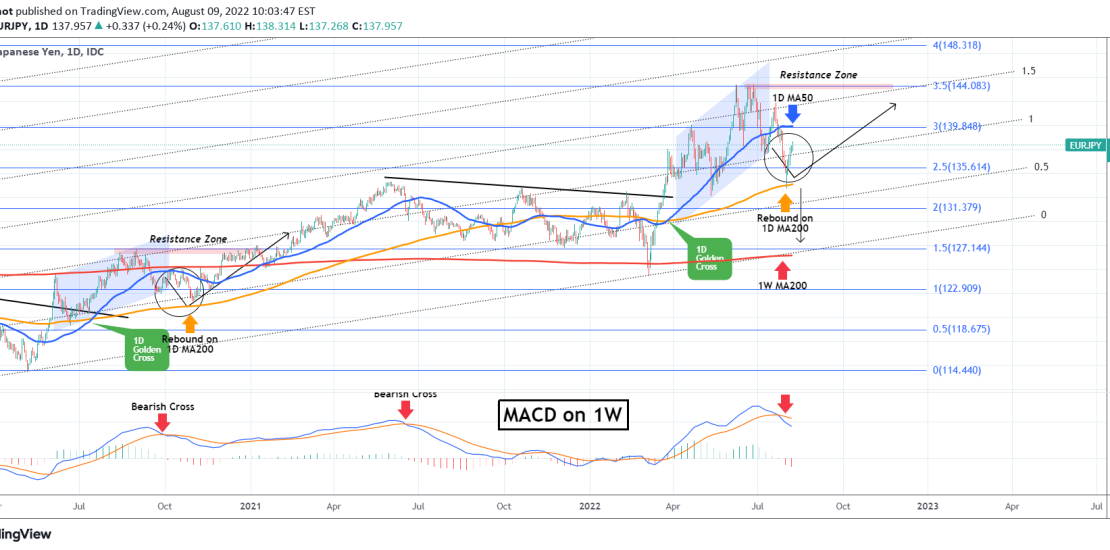
The EURJPY pair has been trading exactly as the plan we first posted here a month ago: As you see, the break below the Channel Up, along with the 1W MACD Bearish Cross, kick-started a sell sequence that eventually found Support and rebounded exactly on the 1D MA200 (orange trend-line). This continues to be
-
CELUSD broke the 1D MA200, first time since last September!
- August 9, 2022
- Posted by: Tradingshot Articles
- Category: Cryptocurrency
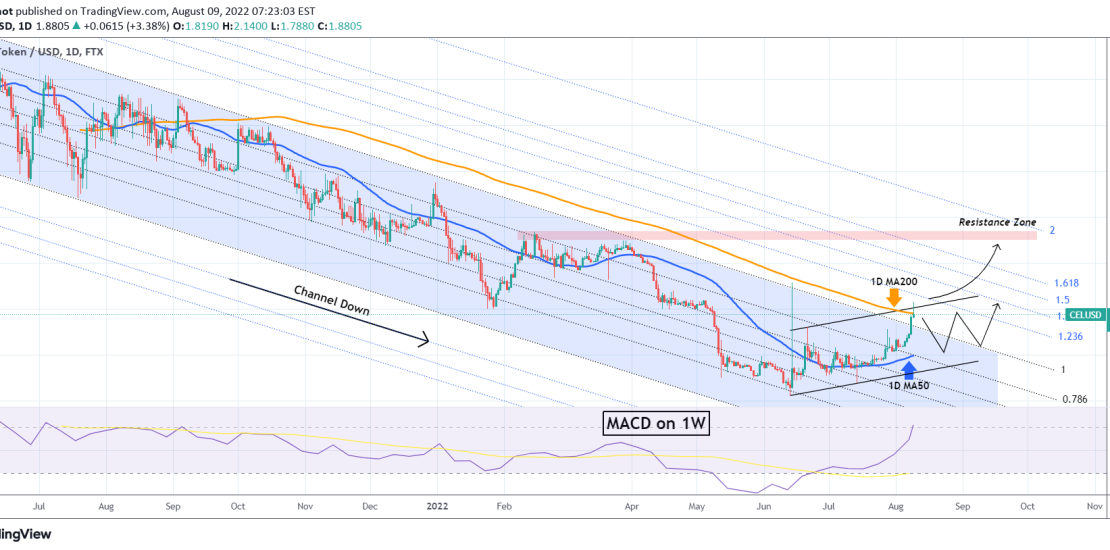
The Celsius Token (CELUSD) broke today above its 1D MA200 (orange trend-line) for the first time since September 07 2021. It is important to see the price close above that level too, as technically a lot of investors could take profits aggressively here. In that case, expect a pull-back to the 1D MA50 (blue
-
EURUSD Quick buy opportunity. Sell then but tight SL.
- August 8, 2022
- Posted by: Tradingshot Articles
- Category: Forex
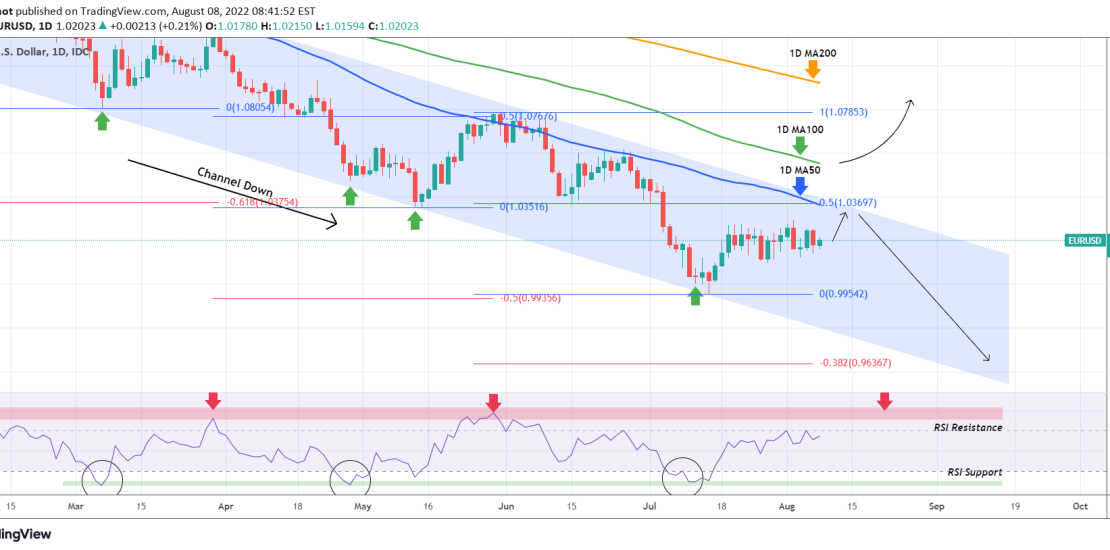
The EURUSD pair has been trading within a Channel Down pattern since the February 10 High (rejection). Every Lower High has been formed on the 0.5 Fibonacci retracement level and we have been targeting this since our last medium-term buy exactly 1 month ago: As you see, despite the initial rebound, the pair turned
-
GASOLINE Head and Shoulders likely to turn long-term bearish
- August 3, 2022
- Posted by: Tradingshot Articles
- Category: Commodities
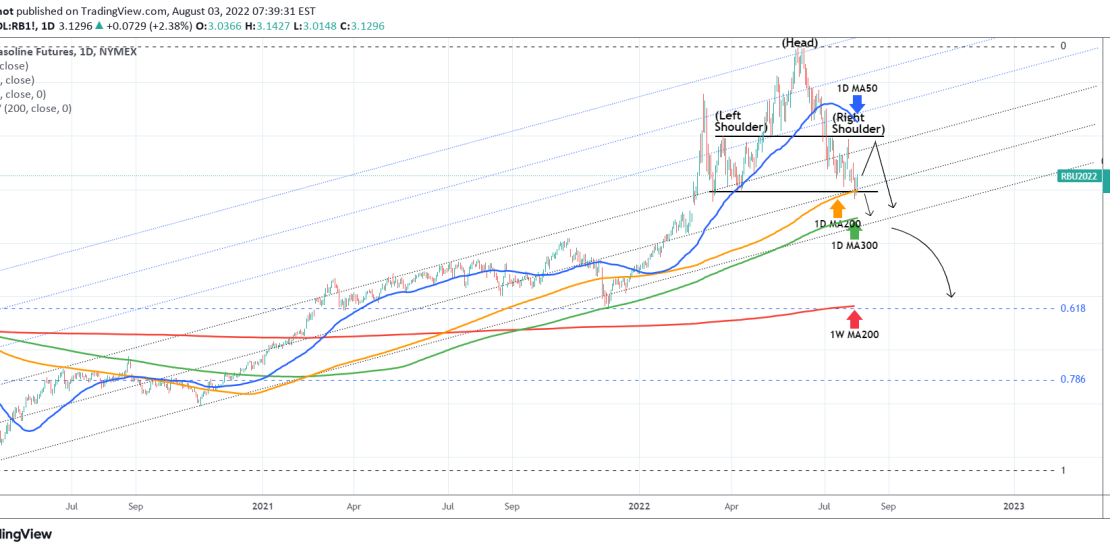
Gasoline (RB1!) has been rising since the March 2020 bottom on a straight Channel until late February 2022 where war and inflation worries turned it parabolic as illustrated by the use of the Fibonacci Channel extensions. Following the June 06 market top, a Head and Shoulders (H&S) pattern was formed that hit (and so
-
BOEING approaching a 1 year MA Resistance Zone
- August 2, 2022
- Posted by: Tradingshot Articles
- Category: Stocks
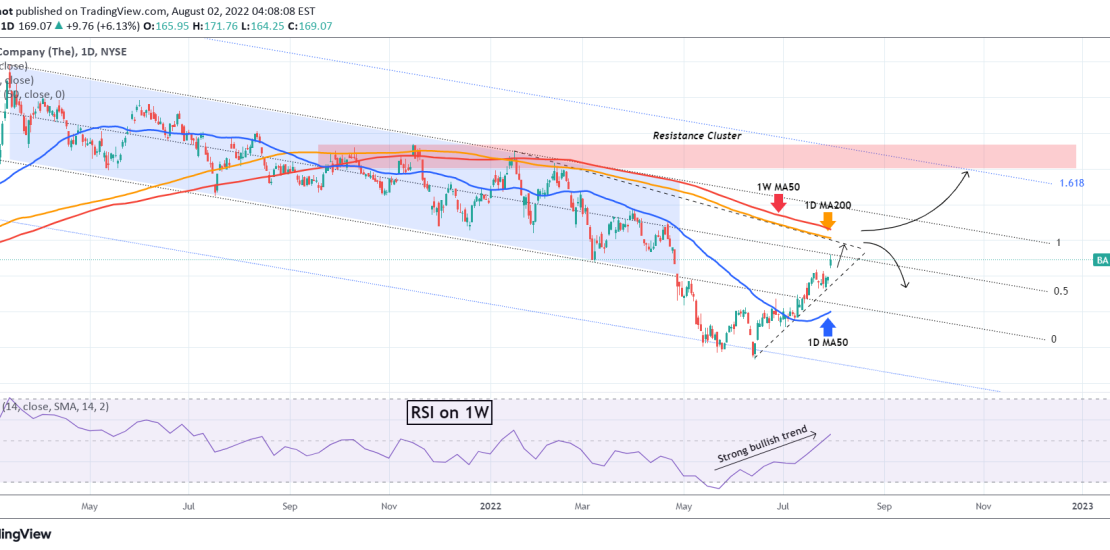
Boeing (BA) has been on a strong rise ever since the June 14 Low, with the 1D MA50 (blue trend-line) supporting. This trend is approaching its most important long-term test as the Resistance Zone formed by the 1D MA200 (orange trend-line) and the 1W MA50 (red trend-line) is just above. This Resistance Zone has
-
SHOPIFY approaching the end of its consolidation. Target $60+.
- August 1, 2022
- Posted by: Tradingshot Articles
- Category: Stocks
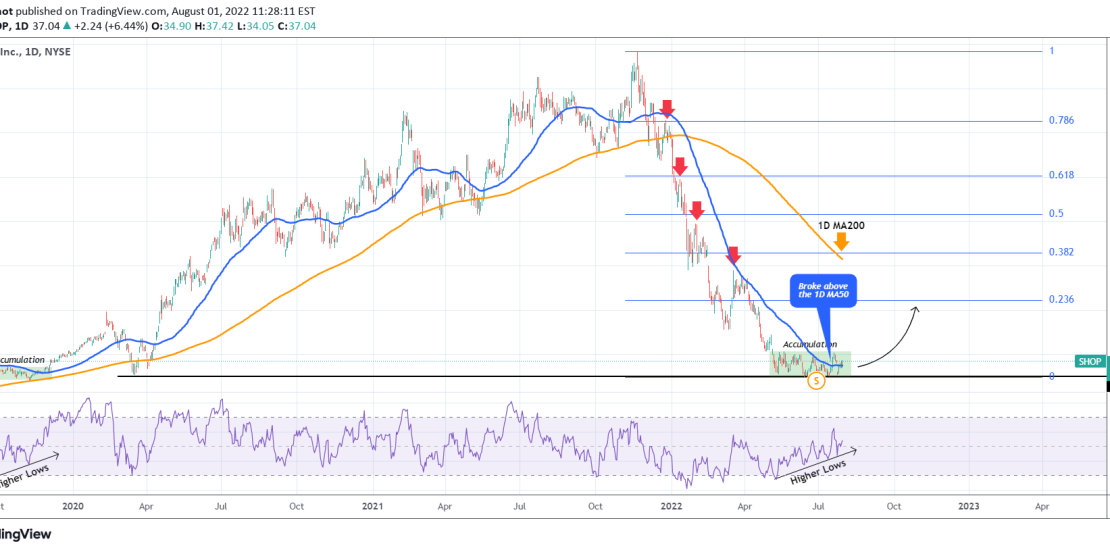
Shopify (SHOP) has been consolidating within an Accumulation Zoen since the May 11 Low. At the same time the 1D RSI has been on Higher Lows indicating a hidden bullish sentiment. The last time we saw that recently was during the September 24 – November 29 2019 Accumulation Phase, which was also on 1D
-
EURUSD going for a 1.0367 High
- August 1, 2022
- Posted by: Tradingshot Articles
- Category: Forex
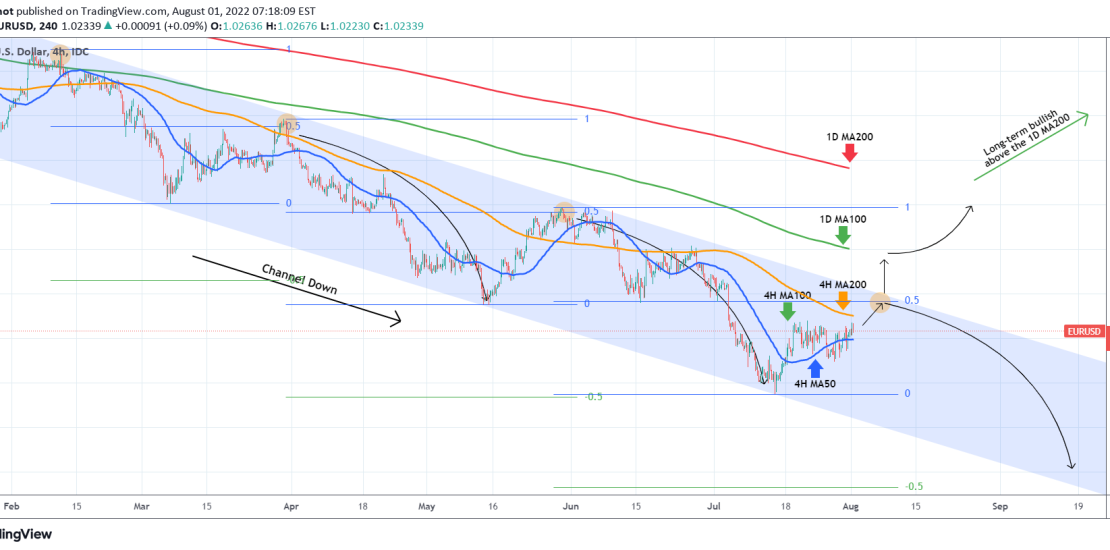
The EURUSD pair continues to trade sideways around the 4H MA50 (blue trend-line), keeping all this time the trend within the strict boarders of the long-term Channel Down pattern since the February 10 High. As this pattern shows, which I’ve been analyzing on all recent posts, every Lower High is always priced above the
- 1
- 2