
-
NETFLIX gives a confirmed MEGA BUY signal
- October 27, 2022
- Posted by: Tradingshot Articles
- Category: Stocks
No Comments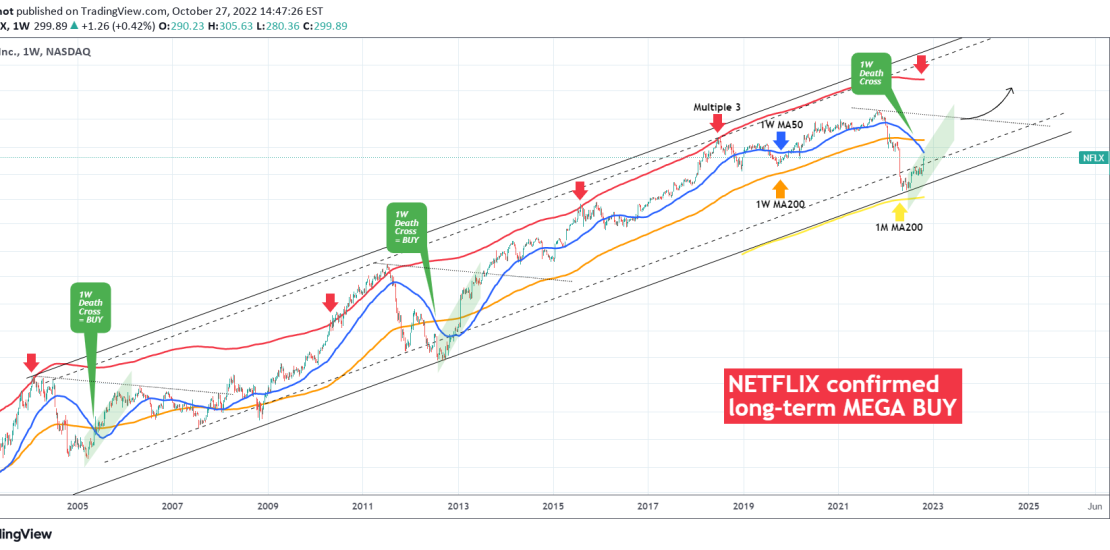
We’ve been bullish on Netflix (NFLX) since early Summer after the price held the 1M MA200 (yellow trend-line), which as we noted on our April 21 analysis, is the historical Support: Even though the drop didn’t complete the expected -80% drop, it did come close enough (-76.50%) and as you see the rebound since
-
ORACLE Broke above the 1D MA50, first time in more than a month
- October 21, 2022
- Posted by: Tradingshot Articles
- Category: Stocks
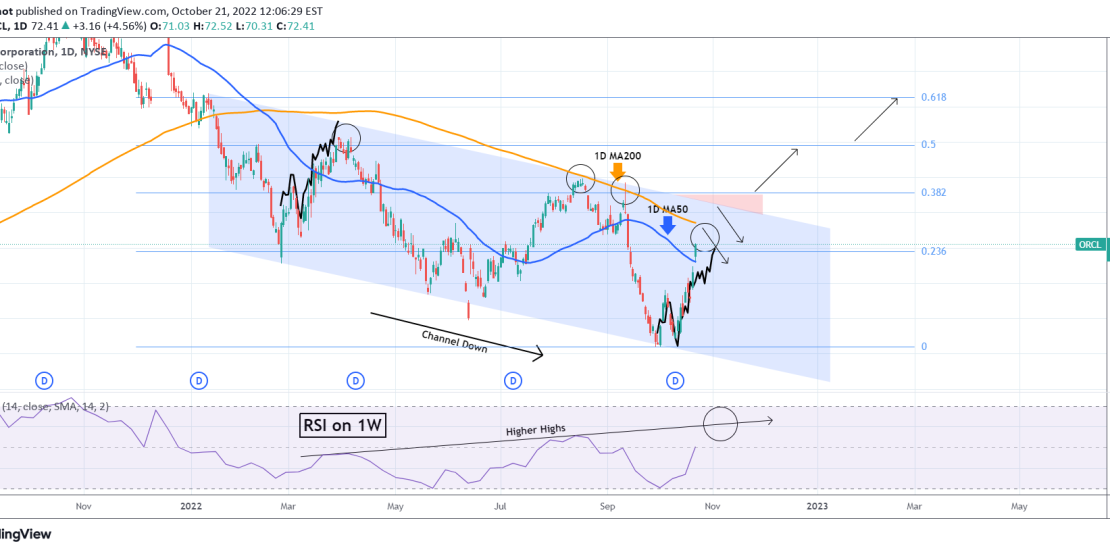
The Oracle Corporation (ORCL) broke today above its 1D MA50 (blue trend-line) for the first time since September 14. Within the long-term Channel Down pattern that the price has been trading in since January 12, this is the fastest break-out after a Lower Low bounce. Basically it resembles the fast rebound after the February
-
DELL Excellent buy opportunity on the break-out
- October 21, 2022
- Posted by: Tradingshot Articles
- Category: Stocks
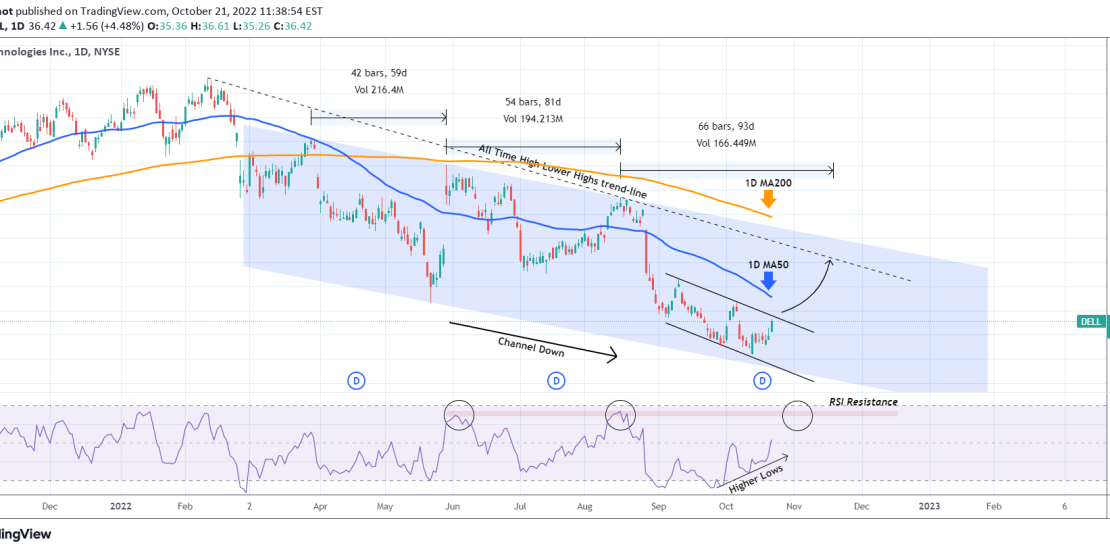
Dell Technologies (DELL) is testing the top (Lower Highs trend-line) of the short-term Channel Down that started after the September 12 High. The 1D MA50 (blue trend-line) is right above it, all within the wider pattern of the long-term Channel Down since the March 29 rejection on the 1D MA50. However, while the price
-
NETFLIX +15% near the 1D MA200 for the first time since January!
- October 19, 2022
- Posted by: Tradingshot Articles
- Category: Stocks
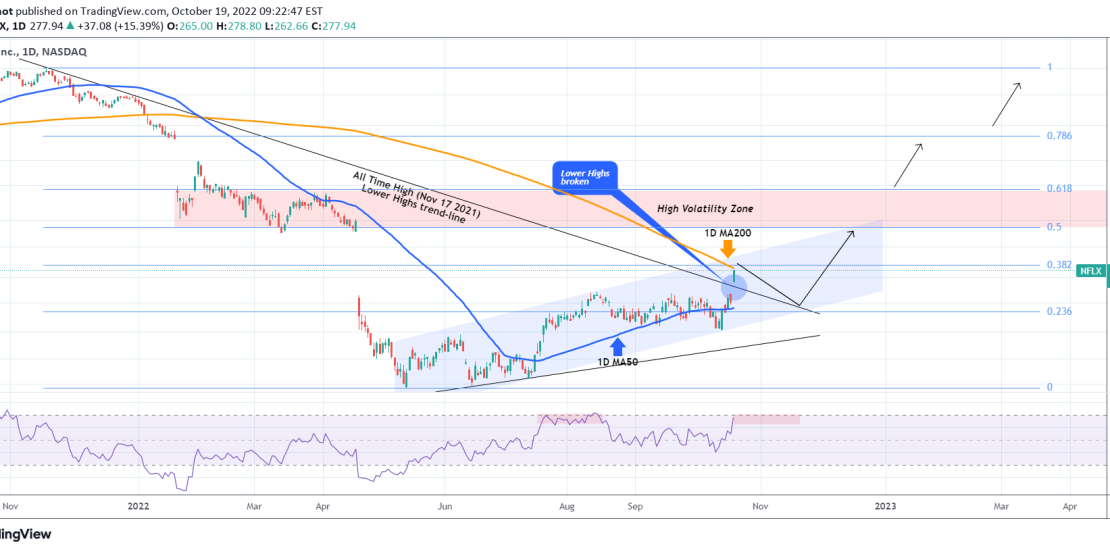
Netflix (NFLX) had its highest daily opening in over one year, rising so far +15.21% form a 240.86 close yesterday to a 277.50 intra day peak. This is of course a fundamental move due to the big earnings surprise yesterday (3.1 EPS against a 2.18 forecast). Technically, this brings the price just below the
-
VISA About to start a historic Bull Cycle similar to post 2009
- August 30, 2022
- Posted by: Tradingshot Articles
- Category: Stocks
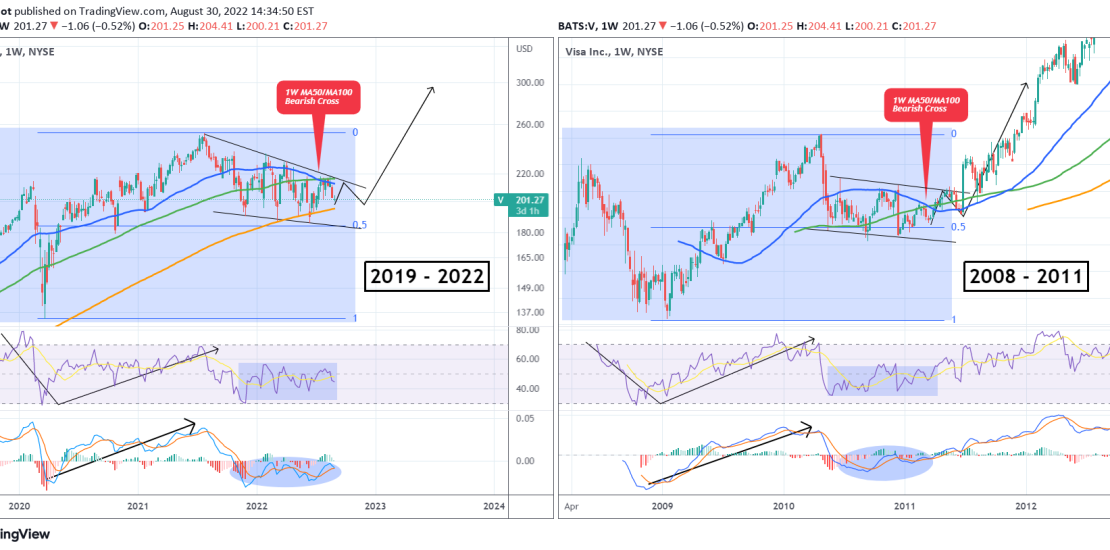
This is Visa Inc. (V) on the 1W time-frame. The primary pattern since the July 26 2021 All Time High (ATH) has been a Falling Wedge and the price continues to hold that formation after being rejected on the August 15 candle on the Lower Highs (top) trend-line. With the 1W MA50 (blue trend-line)
-
BOEING approaching a 1 year MA Resistance Zone
- August 2, 2022
- Posted by: Tradingshot Articles
- Category: Stocks
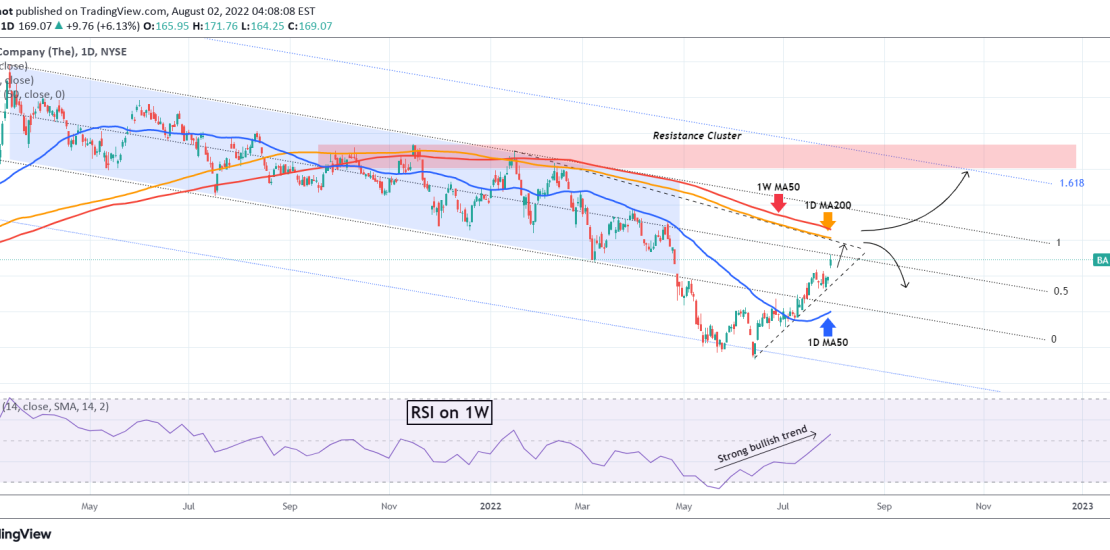
Boeing (BA) has been on a strong rise ever since the June 14 Low, with the 1D MA50 (blue trend-line) supporting. This trend is approaching its most important long-term test as the Resistance Zone formed by the 1D MA200 (orange trend-line) and the 1W MA50 (red trend-line) is just above. This Resistance Zone has
-
SHOPIFY approaching the end of its consolidation. Target $60+.
- August 1, 2022
- Posted by: Tradingshot Articles
- Category: Stocks
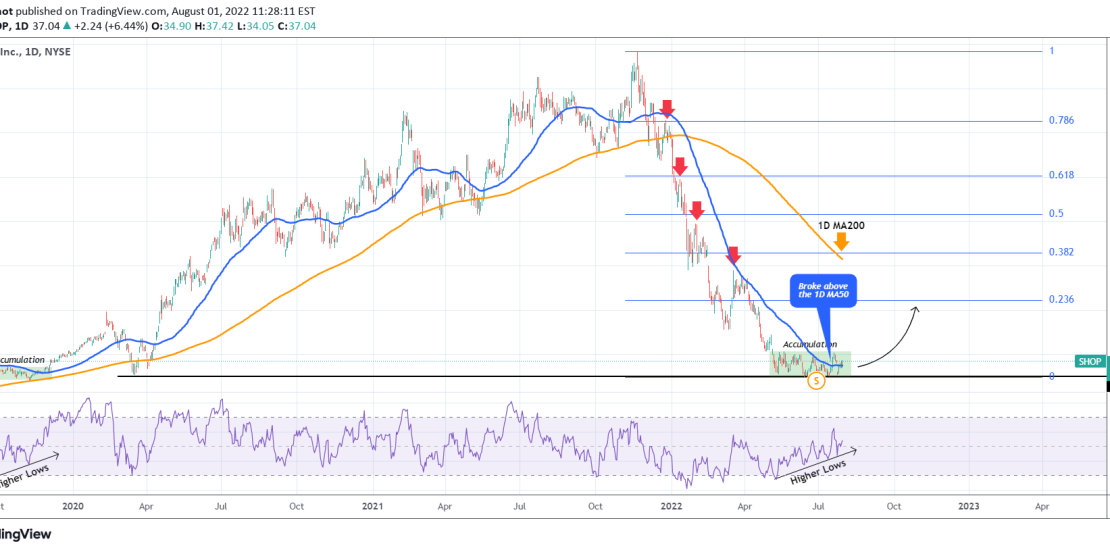
Shopify (SHOP) has been consolidating within an Accumulation Zoen since the May 11 Low. At the same time the 1D RSI has been on Higher Lows indicating a hidden bullish sentiment. The last time we saw that recently was during the September 24 – November 29 2019 Accumulation Phase, which was also on 1D
-
AAPLE holding the 1D MA50, targeting 158 short-term.
- July 15, 2022
- Posted by: Tradingshot Articles
- Category: Stocks
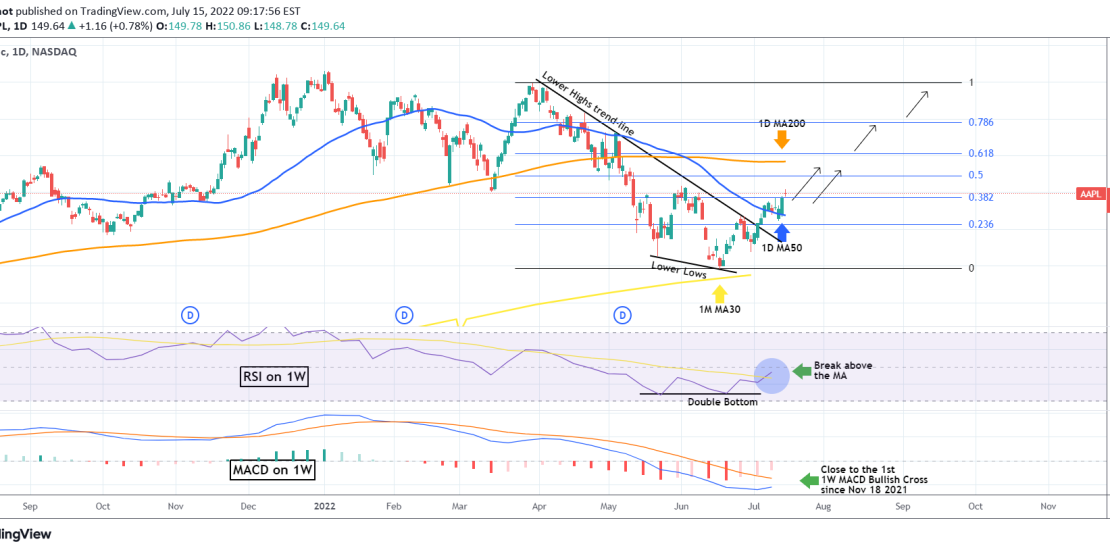
Apple (AAPL) had a very strong 1D green candle yesterday, rebounding off the 1D MA50 (blue trend-line), which has been the Resistance since April 21, turning it into the Support. The break-out took place after the RSI on the 1W time-frame broke above its MA line on the widest margin since January 04. With
-
ENERGIZER Bullish short-term but then watch these levels
- May 9, 2022
- Posted by: Tradingshot Articles
- Category: Stocks
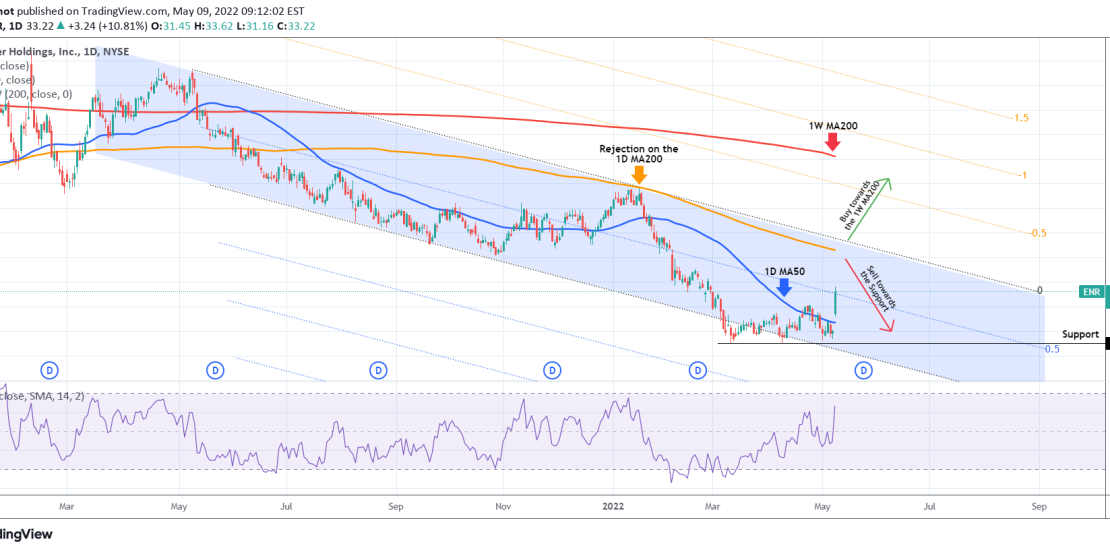
Energizer Holdings (ENR) are one of the pleasant surprises of the day, having jumped more than +10% from their Friday closing. This 1D chart shows the Channel Down the stock has been trading in since May 2021, basically a full year, which broke marginally with the March 10 low, and this is the reason
-
NETFLIX When bubbles pop. The bottom isn’t in yet.
- April 21, 2022
- Posted by: Tradingshot Articles
- Category: Stocks
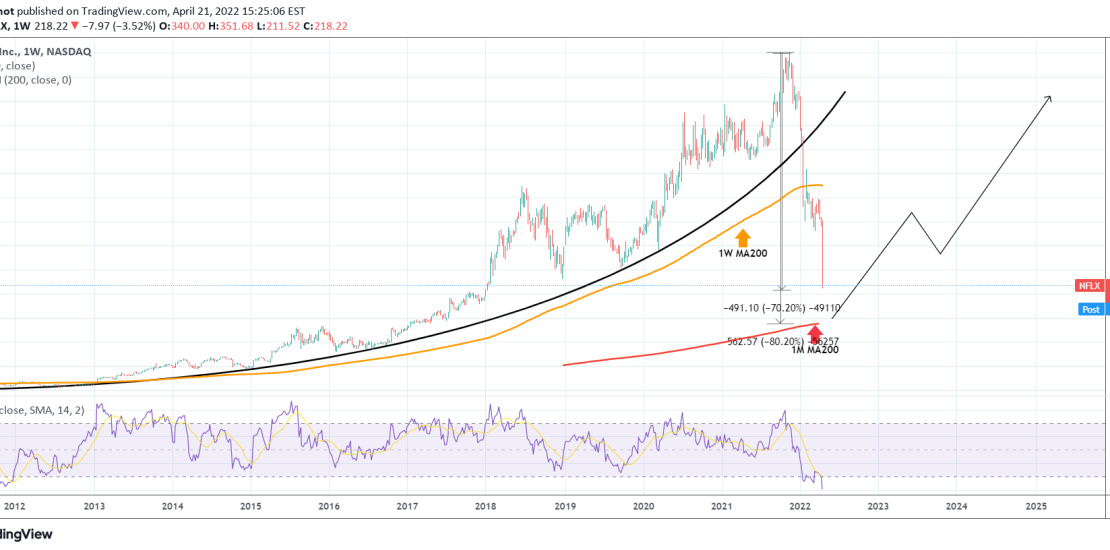
Netfilx (NFLX) is having a historic weekly selling pressure after the negative quarterly report, which showed a loss of 200k subscribers, putting a stop to a growth for the first time in 10 years. This chart on the 1W time-frame shows how the NFLX bubble popped in mid January 2022. The Jan 18 1W
