

- April 21, 2022
- Posted by: Tradingshot Articles
- Category: Stocks
Netfilx (NFLX) is having a historic weekly selling pressure after the negative quarterly report, which showed a loss of 200k subscribers, putting a stop to a growth for the first time in 10 years.
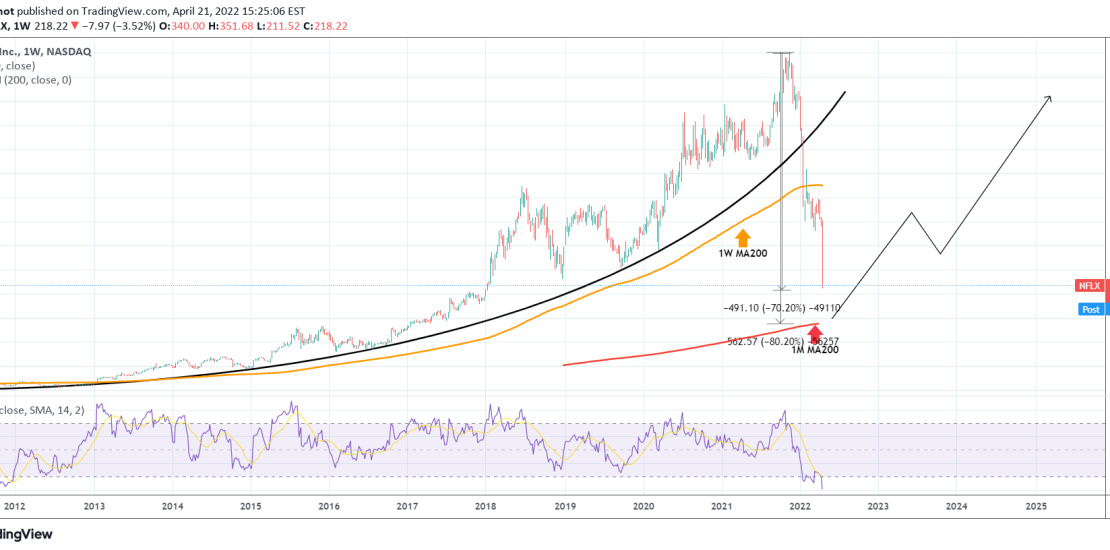
This chart on the 1W time-frame shows how the NFLX bubble popped in mid January 2022. The Jan 18 1W candle broke both below the parabolic growth curve (black) and the 1W MA200 (orange trend-line) in the same week. That was the confirmation of the start of a Bear Cycle. So far the stock is on an almost -70% correction from the November 2021 All Time High (ATH) but this is by no means the bottom.
Since the 1W MA200 broke, which was a trend-line supporting the bubble since January 2013, we have to go to the monthly (1M) time-frame to look for the next Support. That is the 1M MA200 (red trend-line) which is currently at $137.82. If that is reached before June, that would represent a -80% correction from the top, which is typical for Bear Market bottoms. The 1W RSI is at the lowest level historically since Netflix started first trading.
Tradingview link:
https://www.tradingview.com/chart/NFLX/A6I9P0yJ-NETFLIX-When-bubbles-pop-The-bottom-isn-t-in-yet