

- August 2, 2022
- Posted by: Tradingshot Articles
- Category: Stocks
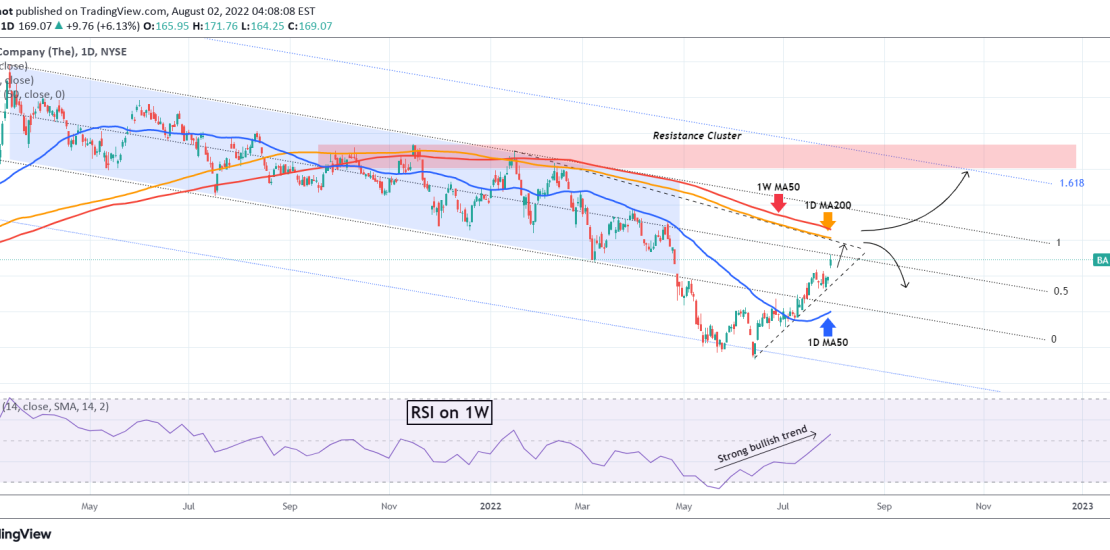
Boeing (BA) has been on a strong rise ever since the June 14 Low, with the 1D MA50 (blue trend-line) supporting. This trend is approaching its most important long-term test as the Resistance Zone formed by the 1D MA200 (orange trend-line) and the 1W MA50 (red trend-line) is just above. This Resistance Zone has rejected every break-out attempt since August 17 2021 (the only 1D candle that closed above was the November 15 2021 but no 1W candle every closed above).
As a result, it is the critical test that will most likely issue the trend of the next months. A 1W close above this Resistance Zone, is a bullish break-out signal targeting $220.00 which is just below the Resistance cluster shown on the chart. A rejection on the 1D MA200/ 1W MA50 Resistance zone, targets the 1D MA50 on the short-term at least. We have to give the bullish break a higher probability as the 1W RSI is on bullish reversal pattern since the May 23 low.
Tradingview link:
https://www.tradingview.com/chart/BA/ZkevlHpK-BOEING-approaching-a-1-year-MA-Resistance-Zone