
-
MCDONALDS Bad for your health – good for your portfolio.
- December 16, 2022
- Posted by: Tradingshot Articles
- Category: Stocks
No Comments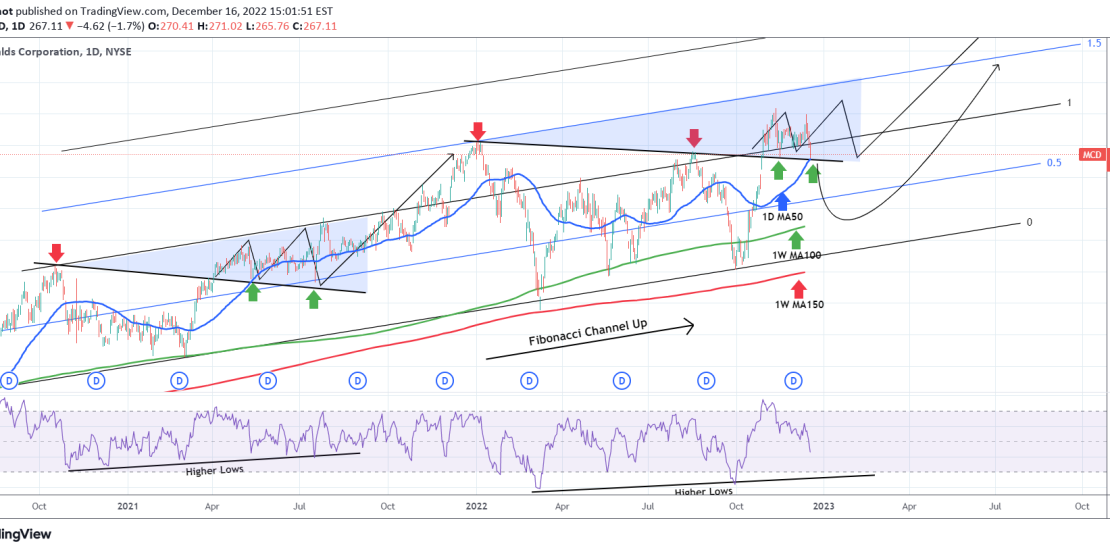
The McDonalds Corporation (MCD) is defying the Bear Market as on November 10 it made a new All Time High. Today it pulled-back to the 1D MA50 (blue trend-line) amidst the general post Fed market drop for the first time in nearly two months (since October 21). As you see it is trading within
-
META reached our target. What’s next?
- December 15, 2022
- Posted by: Tradingshot Articles
- Category: Stocks
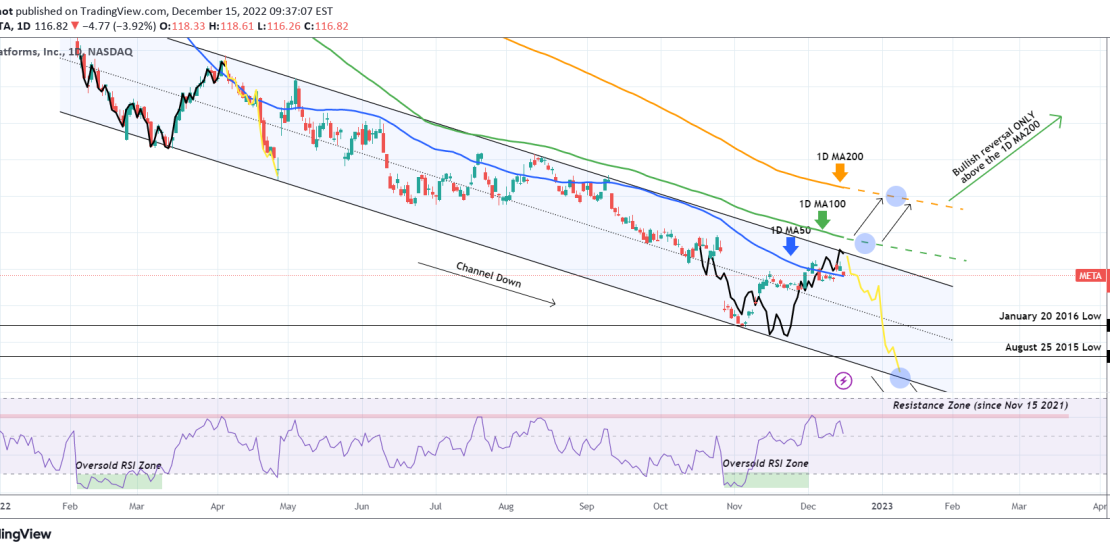
Over a month ago (November 10) we posted our outlook on the Meta Platforms Inc (META) following the cutting of 11k jobs (also feature on the Editor’s Pick): As you see our target has been hit as the price rose and reached the top of the Channel Down pattern that the stock has been
-
MASTERCARD About to break into long-term bullish territory
- December 12, 2022
- Posted by: Tradingshot Articles
- Category: Stocks
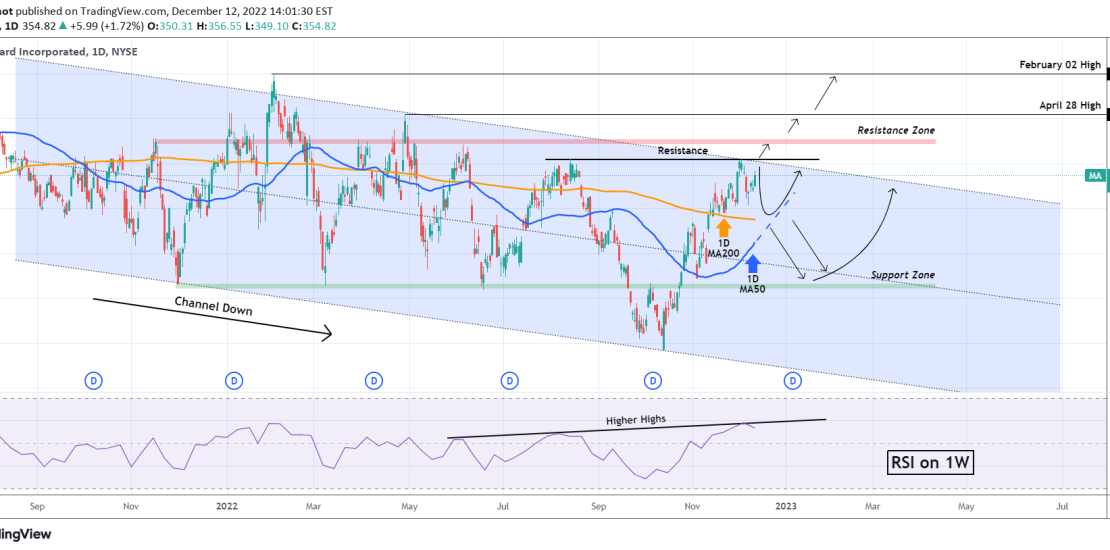
Mastercard Inc (MA) is rebounding again back towards the top of its +1 year Channel Down pattern after the December 02 rejection on the 262.000 Resistance, which happened to be also at the top (Lower Highs trend-line) of the Channel. If the price breaks above, that alone would be a major bullish break-out signal
-
PROCTER & GAMBLE Rejection approaching. Expect ~$140.
- December 8, 2022
- Posted by: Tradingshot Articles
- Category: Stocks
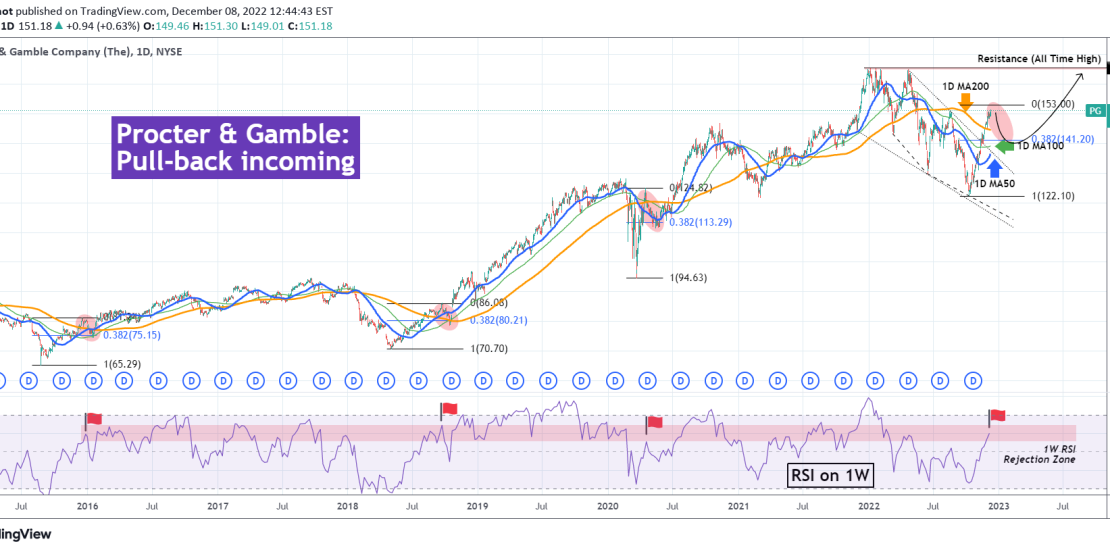
Procter & Gamble (PG) has been on a relentless +23% 2-month rally (since October 10), breaking above all possible MA levels: the 1D MA50 (blue trend-line), the 1D MA100 (green trend-line) and the 1D MA200 (orange trend-line). Today it even broke above the August 16 High, the technical Resistance, making the first Higher High
-
NETFLIX 1D Golden Cross historically shows fast recovery.
- December 2, 2022
- Posted by: Tradingshot Articles
- Category: Stocks
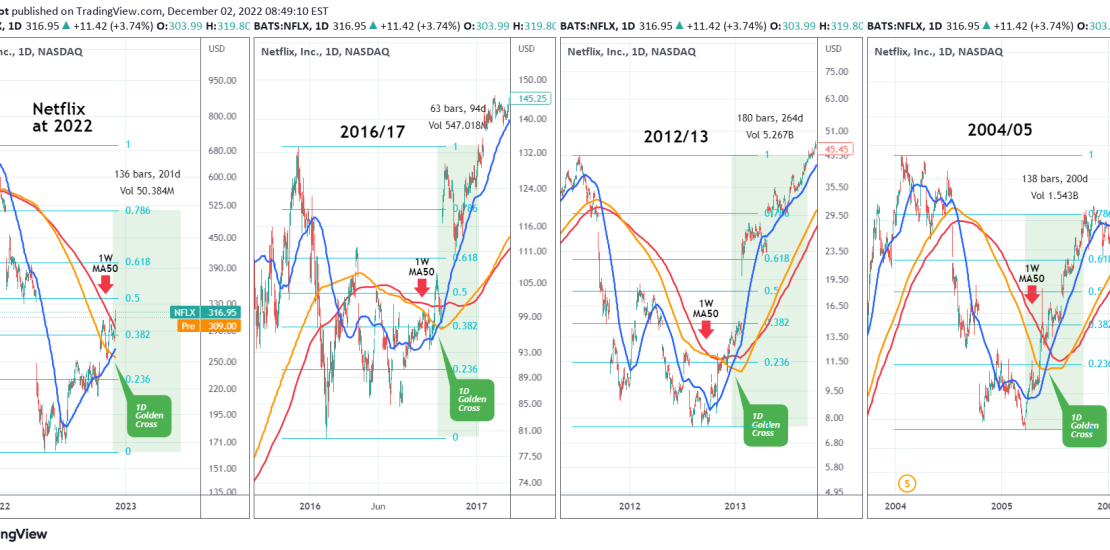
Netflix (NFLX) completed last week the Golden Cross pattern on the 1D time-frame, which is when the 1D MA50 (blue trend-line) crosses above the 1D MA200 (orange trend-line). By doing so it closed yesterday above the 1W MA50 (red trend-line) for the first time since January 06 2022, practically when its Bear Market was
-
WALMART may be approaching the end of this rally
- November 29, 2022
- Posted by: Tradingshot Articles
- Category: Stocks
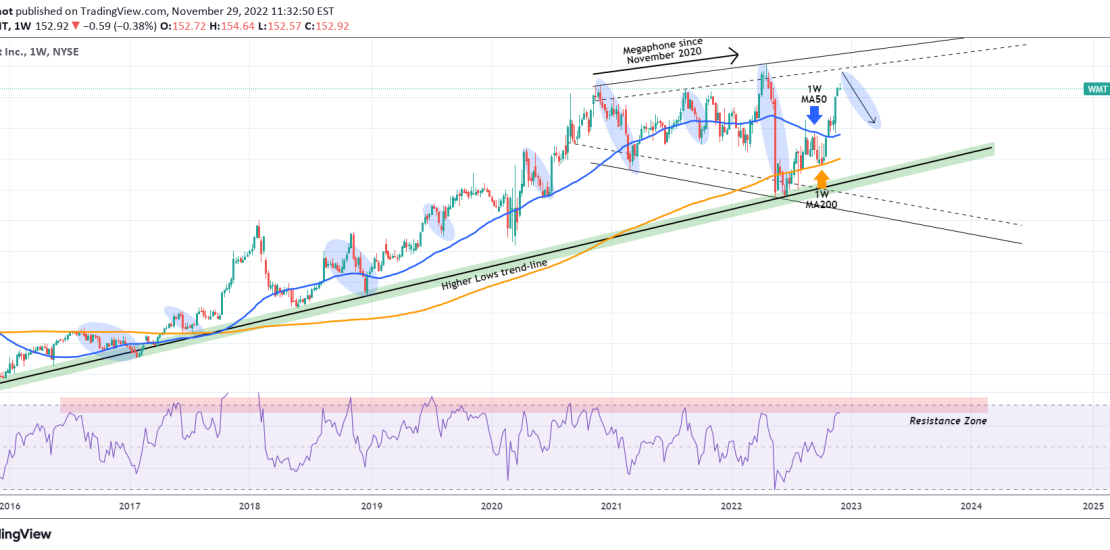
Walmart Inc. (WMT) has been rising since the low of the June 13 2022 weekly (1W) candle. Along the way it broke above the key Resistance of the 1W MA50 (blue trend-line) and after it held the 1W MA200 (orange trend-line), it has established both as Support levels long-term. There are however two longer
-
BERKSHIRE HATHAWAY repeating the post COVID recovery!
- November 23, 2022
- Posted by: Tradingshot Articles
- Category: Stocks
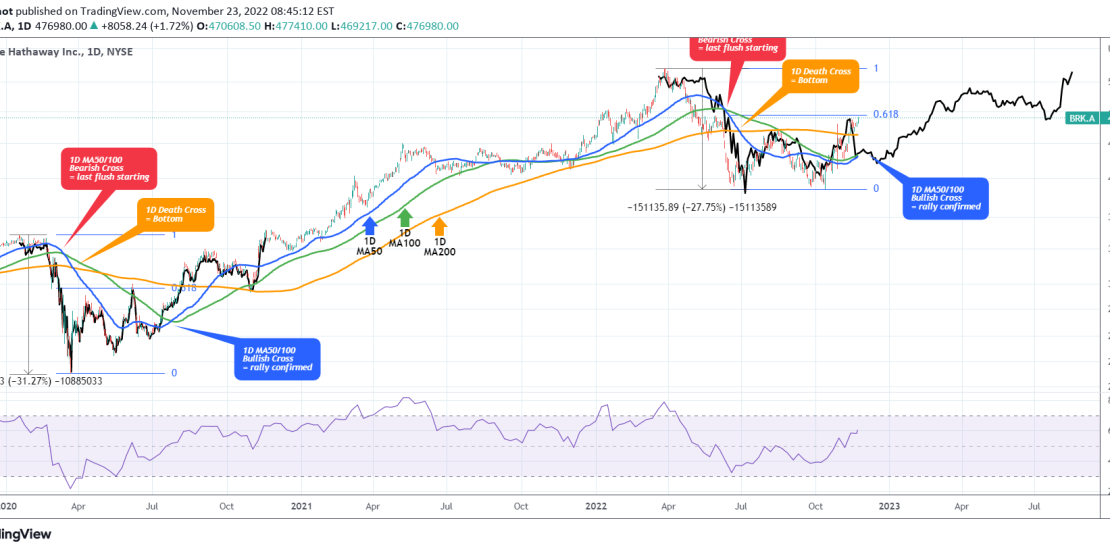
Berkshire Hathaway Inc. (BRK.A) made a new ~5 month High yesterday, spearheading the bullish reversal of high cap stocks at the moment. The price is above the 1D MA200 (orange trend-line) and well above the 1D MA100 (green trend-line) and 1D MA50 (blue trend-line), the latter two are about to make a Bullish Cross.
-
VISA About to start a historic Bull Cycle similar to post 2009
- November 23, 2022
- Posted by: Tradingshot Articles
- Category: Stocks
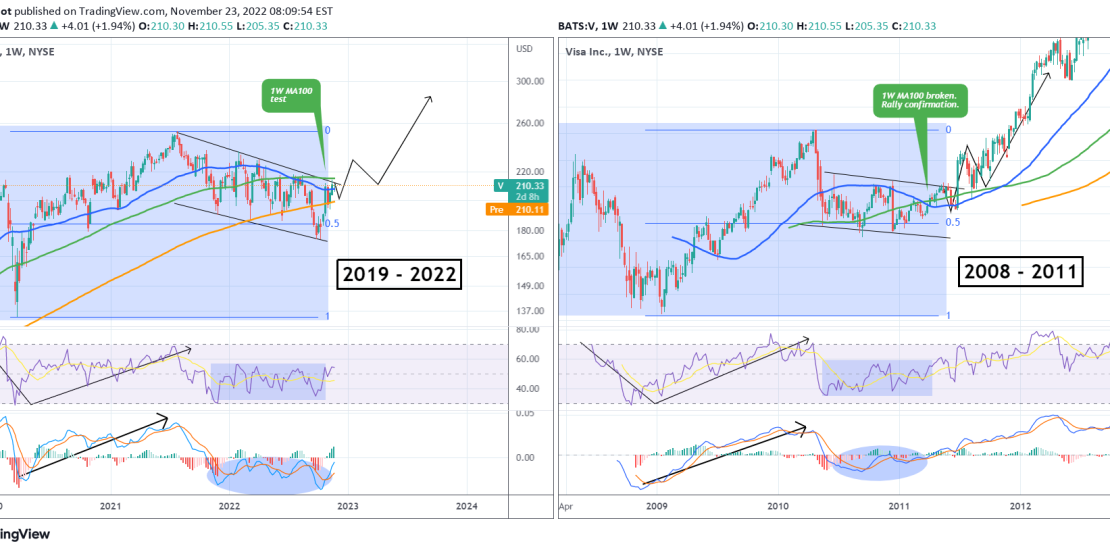
This is Visa Inc. (V) on the 1W time-frame. The primary pattern since the July 26 2021 All Time High (ATH) has been a Channel Down with the price hitting yesterday the top of the pattern for the first time since August 15. The August 15 candle rejection was also made (after multiple attempts)
-
META Can cutting 11000 jobs reverse the bearish outlook alone?
- November 10, 2022
- Posted by: Tradingshot Articles
- Category: Stocks
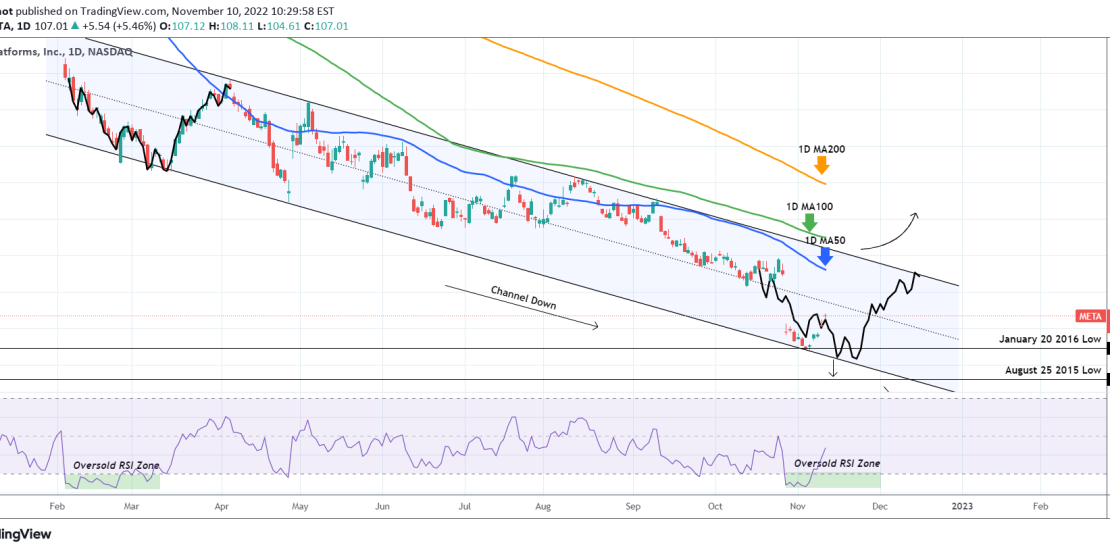
The news of a 11k jobs cut had an immediate bullish impact on the Meta Platforms Inc (META) stock, helping it break above the 100.00 barrier again. Today’s much lower than expected CPI number is also adding fuel on this rally but can those alone push the price out of the death spiral it
-
GOOGLE A very bullish 2023 and this chart shows why.
- November 7, 2022
- Posted by: Tradingshot Articles
- Category: Stocks
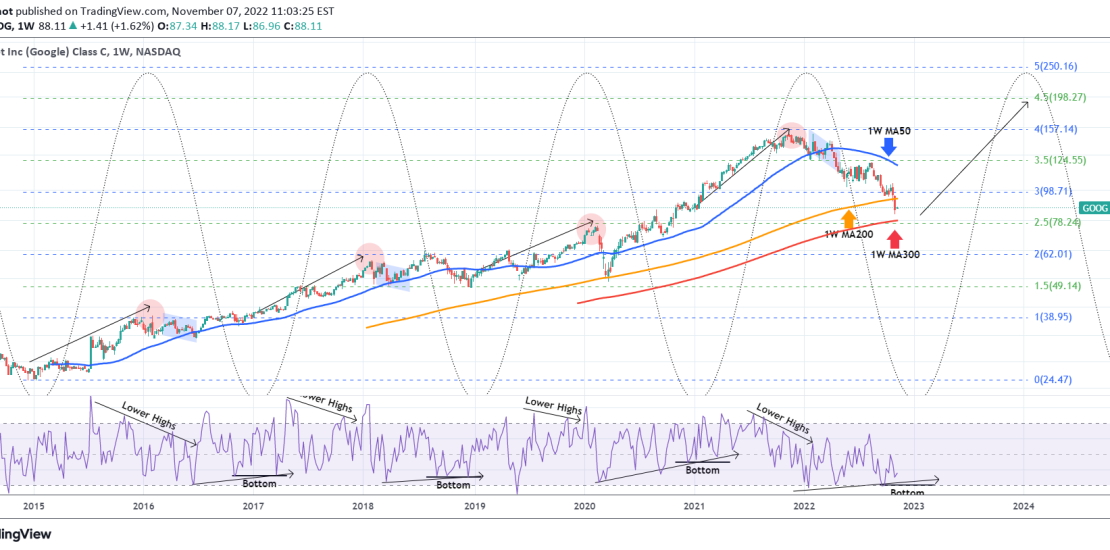
Alphabet Inc. (GOOG) broke two weeks ago below its 1W MA200 (orange trend-line) for the first time since the March 2020 COVID crash. The next Support level is the 1W MA300 (red trend-line). Since its IPO, the stock has had very symmetric Cycles which with the help of the Sine Waves can show tops
