

- October 21, 2022
- Posted by: Tradingshot Articles
- Category: Stocks
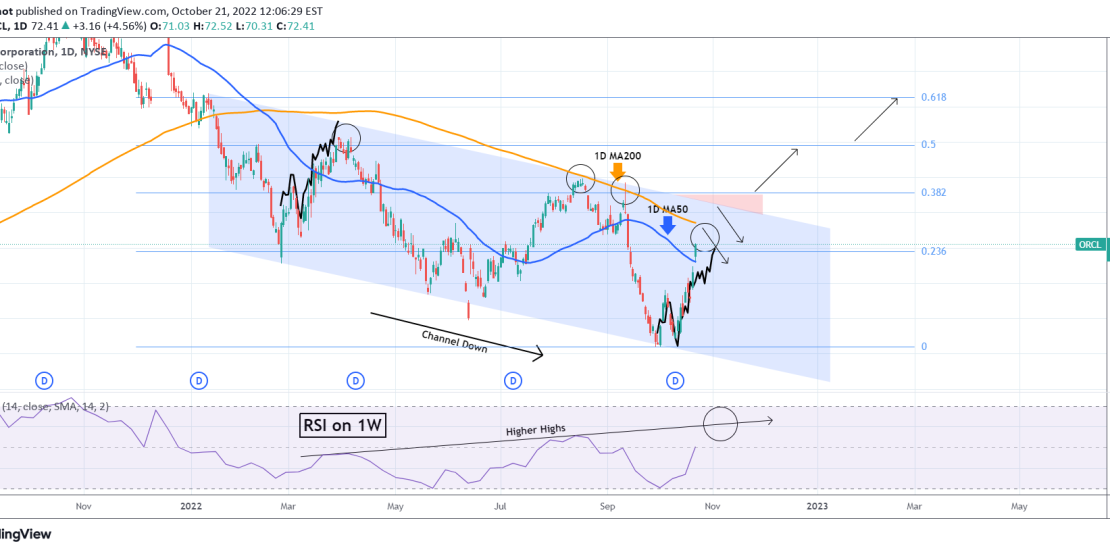
The Oracle Corporation (ORCL) broke today above its 1D MA50 (blue trend-line) for the first time since September 14. Within the long-term Channel Down pattern that the price has been trading in since January 12, this is the fastest break-out after a Lower Low bounce. Basically it resembles the fast rebound after the February 24 Low and in order for you to see the similarities I have plotted it on the current price action.
Technically, the top should be either on the 1D MA200 (orange trend-line) or the Lower Highs trend-line of the Channel Down. A break above the Lower Highs though, and more importantly the 0.382 Fibonacci retracement level, can potentially be a signal that the long-term sentiment has shifted back to being bullish and the upper Fibs should be targeted. It is worth noting that while the price has been trading on Lower Highs, the RSI on the 1W time-frame has been trading on Higher Highs. This divergence could be an early sign of an upcoming trend change.
Tradingview link: