

- May 9, 2022
- Posted by: Tradingshot Articles
- Category: Stocks
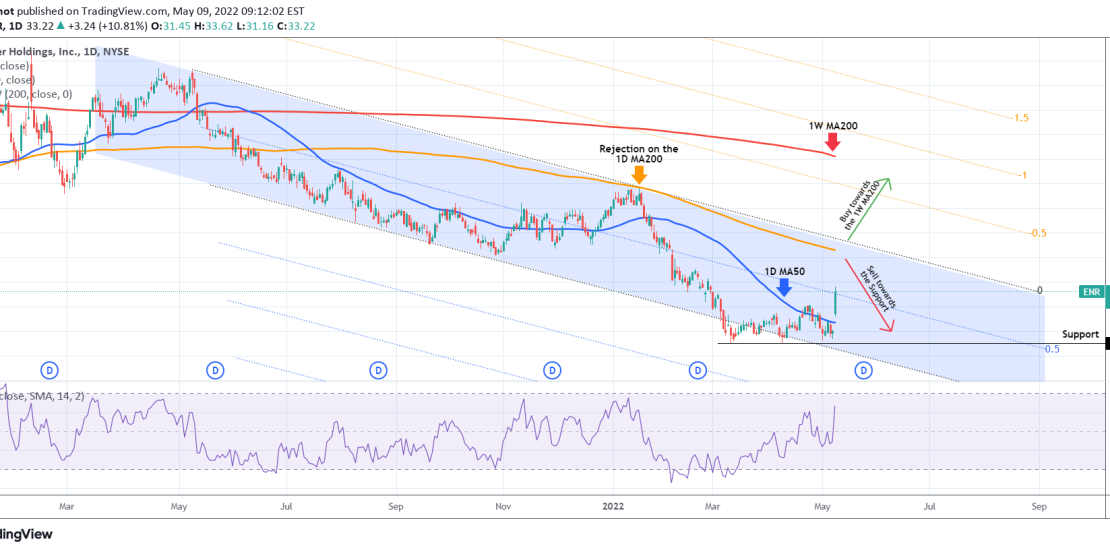
Energizer Holdings (ENR) are one of the pleasant surprises of the day, having jumped more than +10% from their Friday closing. This 1D chart shows the Channel Down the stock has been trading in since May 2021, basically a full year, which broke marginally with the March 10 low, and this is the reason I included the Fibonacci extensions.
Regardless of that, last time the price broke above its 1D MA50 (blue trend-line), it rose as high as the 1D MA200 (orange trend-line), where it got rejected. As a result, we have a short-term bullish pattern towards the 1D MA200. After that, it all depends on the 1D candle closings. Above the 1D MA200, the trend shifts from bearish long-term to bullish with a first target on the 1W MA200 (red trend-line). Any other closing, is a sell aimed at the 29.00 Support.
Tradingview link: