

- November 23, 2022
- Posted by: Tradingshot Articles
- Category: Stocks
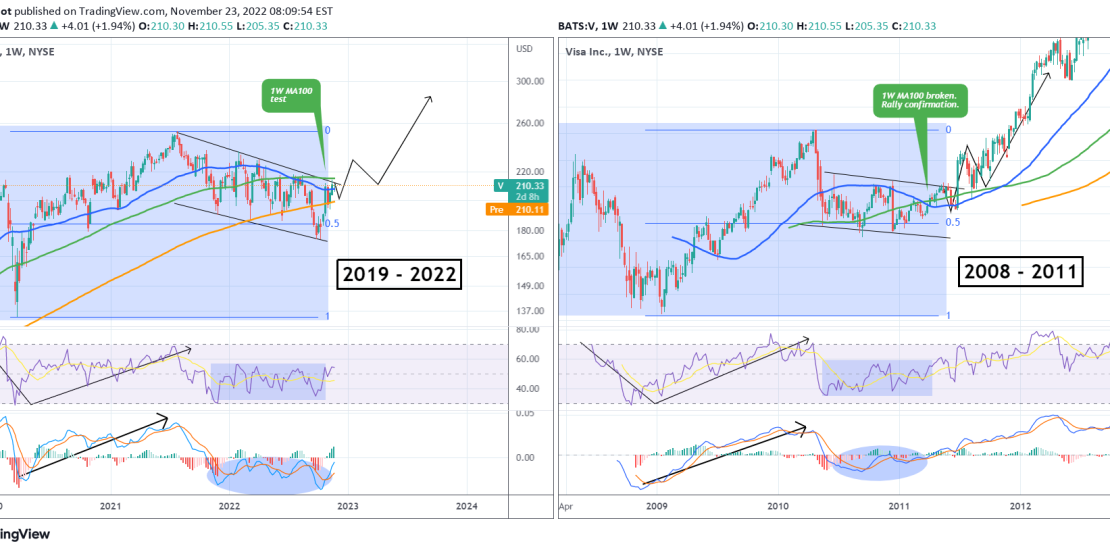
This is Visa Inc. (V) on the 1W time-frame. The primary pattern since the July 26 2021 All Time High (ATH) has been a Channel Down with the price hitting yesterday the top of the pattern for the first time since August 15. The August 15 candle rejection was also made (after multiple attempts) on the 1W MA100 (green trend-line).
The pattern is similar to the one Visa has been trading in since mid 2019. This idea compares the two eras: 2019 – 2022 and 2008 – 2011. In 2011, the stock was trading within a similar Channel Down as the accumulation pattern, with its Lows contained around the 0.5 Fibonacci retracement level. Following the break above the 1W MA100, the price made one last Lower High, pulled-back and then broke above the pattern aggressively. If the same formation continues to be repeated then we can have a break above the Channel Up by mid December. See also how the RSI and MACD patterns are similar.
Tradingview link: