

- November 7, 2022
- Posted by: Tradingshot Articles
- Category: Stocks
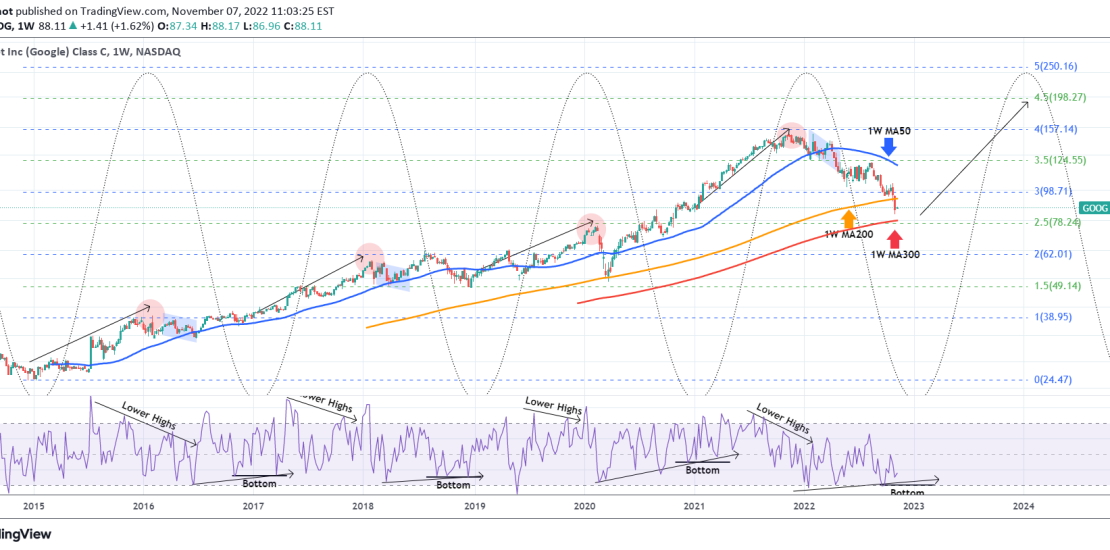
Alphabet Inc. (GOOG) broke two weeks ago below its 1W MA200 (orange trend-line) for the first time since the March 2020 COVID crash. The next Support level is the 1W MA300 (red trend-line). Since its IPO, the stock has had very symmetric Cycles which with the help of the Sine Waves can show tops and bottoms for consistent sells and buys.
On this pattern, the price level is not as important as the timing. As you see even the latest (All Time) High was fairly accurately predicted by the Sine Waves. The next bottom is projected to be by the first week of January the latest. As a result, on a multi-year scale investment strategy, the time to buy Google comes closer and closer.
Based on the Fibonacci extension levels involved, every Cycle High is at least +0.5 Fib higher than the previous one (basically only one has been +0.5, the rest have been at least +1.0 Fib). As a result, the High of the next Cycle should be at least on the 4.5 Fibonacci extension, around $198.00!
Can 2023 be such a bullish year for the tech giant amidst the Bear Market of rising inflation?
Tradingview link:
https://www.tradingview.com/chart/GOOG/ZEpSE5QR-GOOGLE-A-very-bullish-2023-and-this-chart-shows-why