

- December 15, 2022
- Posted by: Tradingshot Articles
- Category: Stocks
Over a month ago (November 10) we posted our outlook on the Meta Platforms Inc (META) following the cutting of 11k jobs (also feature on the Editor’s Pick):

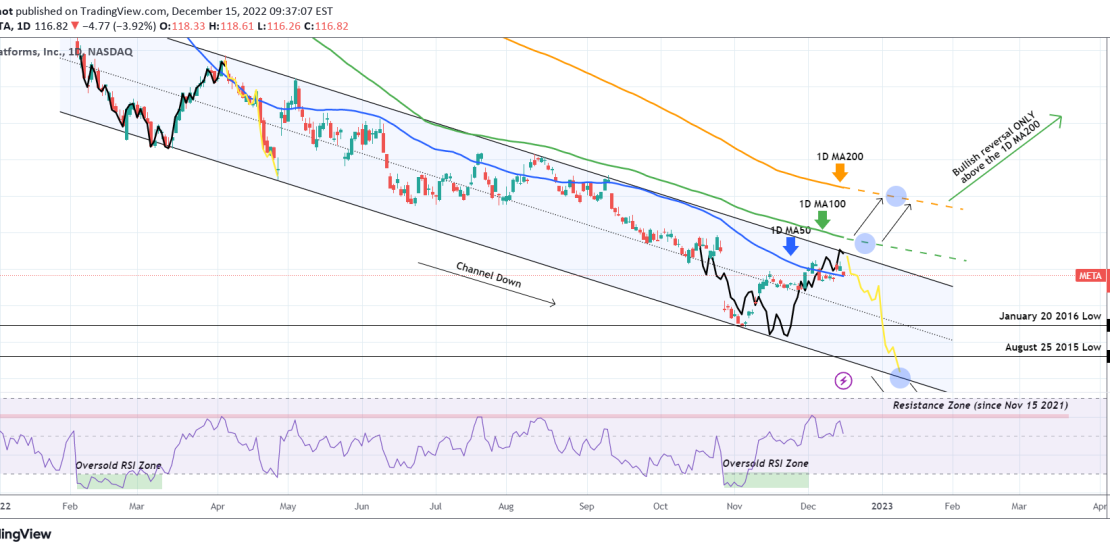
As you see our target has been hit as the price rose and reached the top of the Channel Down pattern that the stock has been trading in since February. The buy signals at the time were obvious as the 1D RSI bounced on the Oversold Zone as it did back in late February/ early March. The question is what happens now?
Well we will not diverge from our usual pattern break-out strategies. Right now the stock is on sell levels, being that close to the top (Lower Highs) trend-line of the Channel Down as well as having hit the RSI’s Resistance Zone (red). As you see, this is the zone where since November 15 2021 (i.e. more than a year) forms all the Lower High rejections on META. For as long as this holds, we expect the price to hit 89.25 (January 20 2016 Low) and the 72.10 (August 25 2015 Low).
On the other hand, we will buy if the price breaks above the 1D MA100 (green trend-line), which has been unbroken since December 30 2021, and target the 1D MA200 (orange trend-line). A candle closing above the 1D MA200 (preferably on the weekly scale), should be enough to confirm META turning bullish on the long-term.
Tradingview link:
https://www.tradingview.com/chart/META/27V1aEQK-META-reached-our-target-What-s-next