
-
S&P500 The 1D MA50 is resisting. Scenarios ahead.
- June 8, 2022
- Posted by: Tradingshot Articles
- Category: Stock Indices
No Comments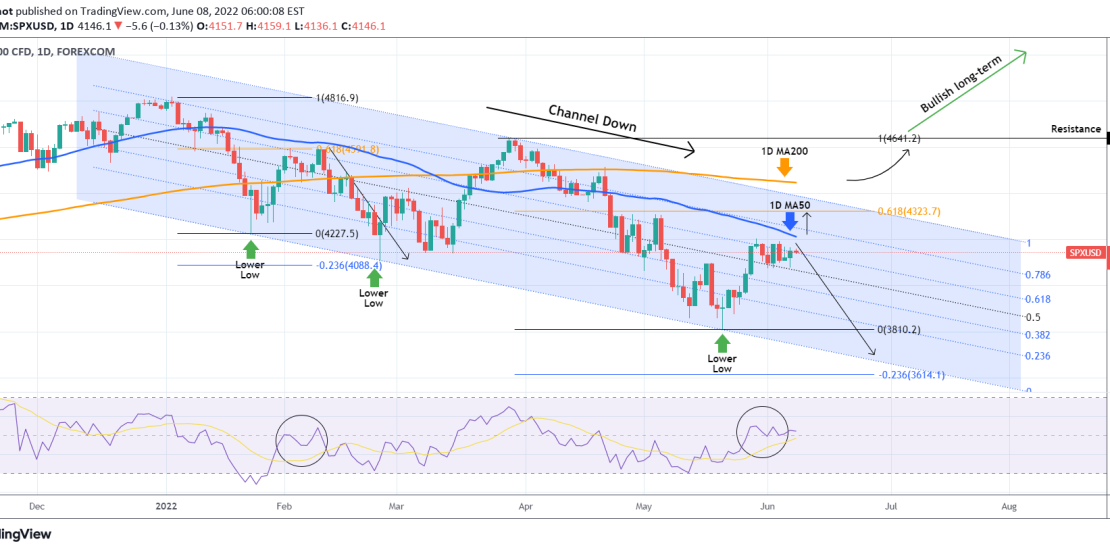
The S&P500 index (SPX) rose rapidly and almost hit its 1D MA50 (blue trend-line), which is the current Resistance, since our last post: The long-term pattern remains a Channel Down since the All Time Highs (ATH), so the trend remains bearish towards the 3810 Support and quite possibly the -0.236 Fibonacci extension as a
-
NASDAQ Sideways but still off the top of the Channel Down
- June 6, 2022
- Posted by: Tradingshot Articles
- Category: Stock Indices
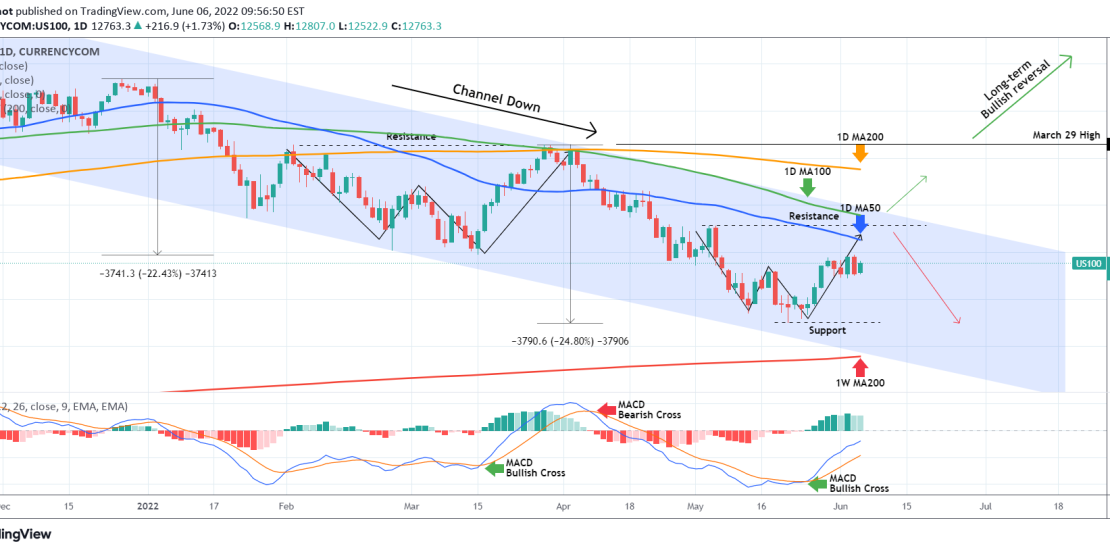
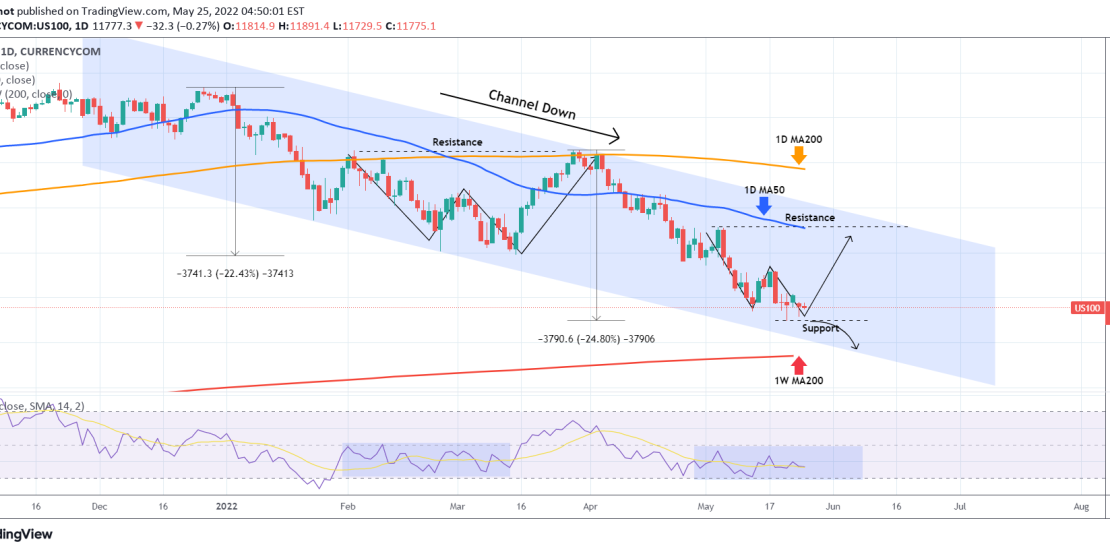
Nasdaq (NDX) has been trading sideways since May 30. The 1D MA50 (blue trend-line) is right above with the 1D MA100 (green trend-line) being roughly around the Lower Highs (top) trend-line of the Channel Down. Based on our previous analysis 2 weeks ago, the index was on a W pattern aiming at the Resistance
-
DOW JONES Consolidating below the 1D MA50 for a week
- June 6, 2022
- Posted by: Tradingshot Articles
- Category: Stock Indices
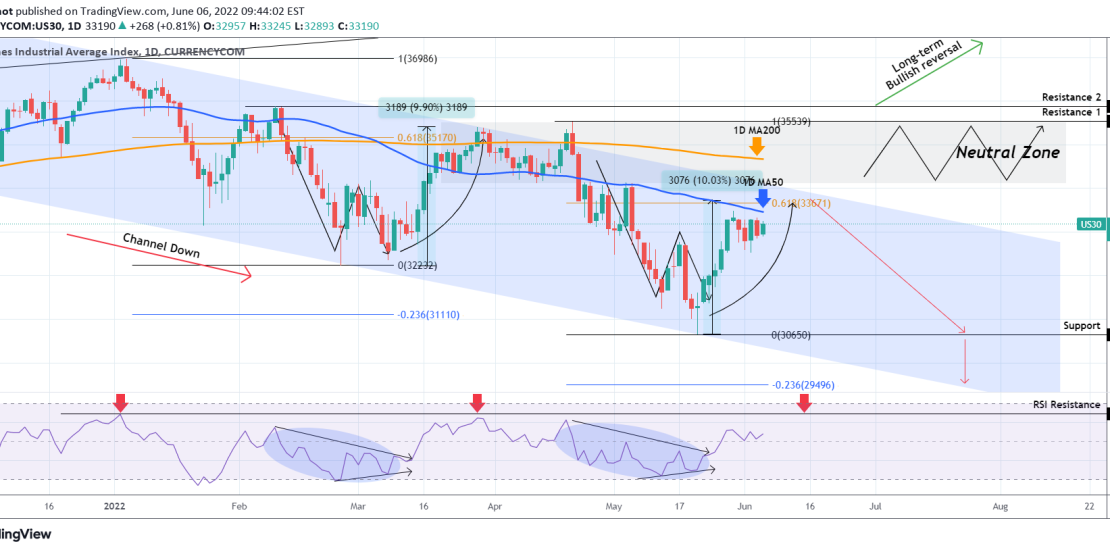
Dow Jones (DJI) eventually rebounded at the bottom (Lower Lows trend-line) of its long-term Channel Down, since our last analysis that indicated a sold R/R ratio for going long: Since the end of May though, the index has failed just before a 1D MA50 (blue trend-line) test and turned sideways below that level. This
-
INFLATION testing a 100 year old trend-line. How will S&P react?
- June 2, 2022
- Posted by: Tradingshot Articles
- Category: Other, Stock Indices
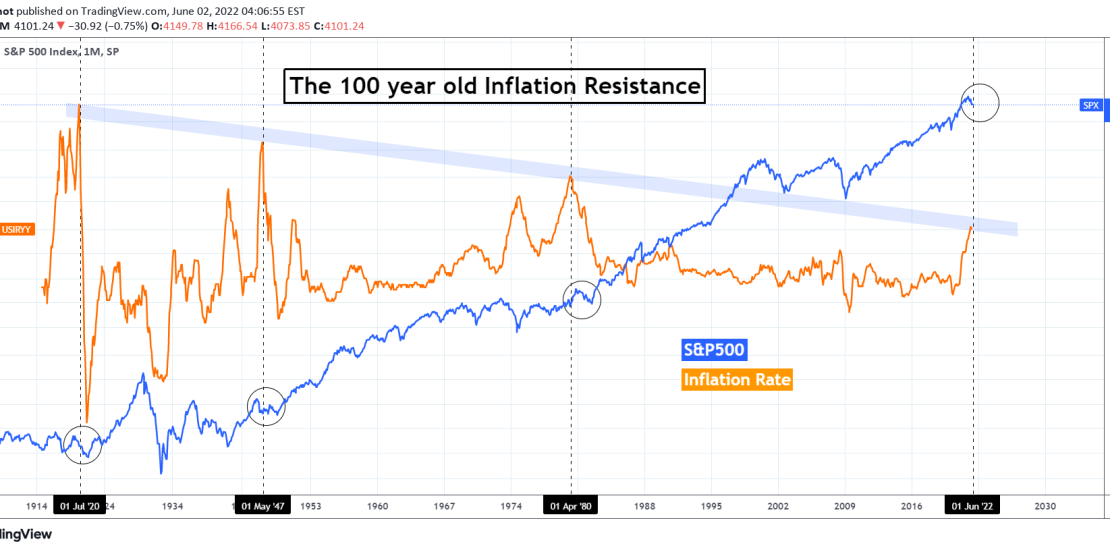
This is an interesting analysis as the U.S. Inflation Rate (orange trend-line) is testing for the first time since early 1980 a Lower Highs trend-line that started after the High of July 1920, exactly 100 years ago! This Lower Highs trend-line has made another 2 contacts after that and it is interesting to see
-
NIKKEI A great opportunity to invest. 7 years recurring pattern
- May 26, 2022
- Posted by: Tradingshot Articles
- Category: Stock Indices
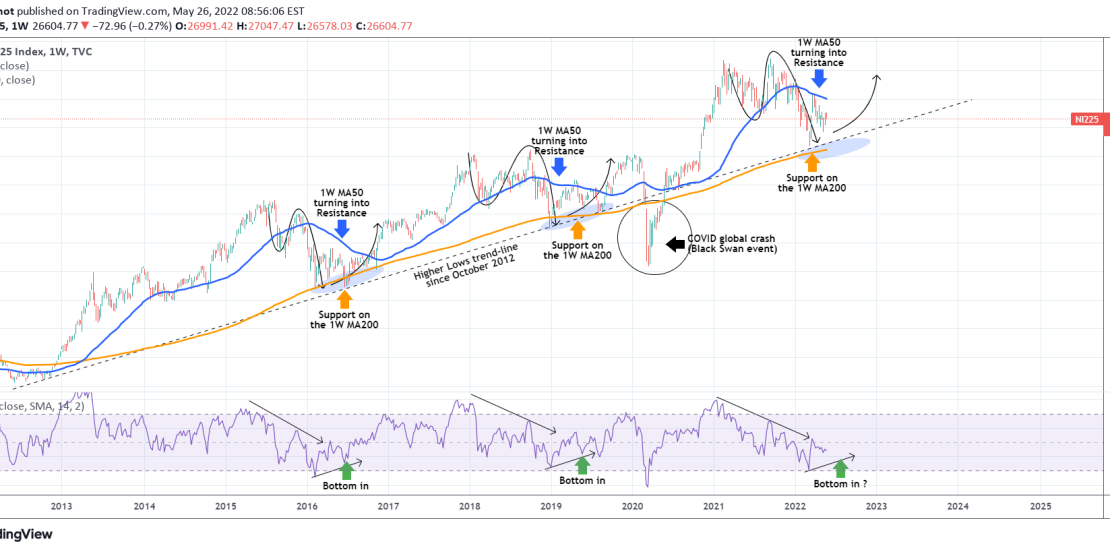
The Nikkei index (NI225) has been on a strong correction phase since its September Highs. Despite the early March rebound just above the 1W MA200 (orange trend-line), it was rejected on the 1W MA50 (blue trend-line) pulling the index back towards the lows. Notice on this chart, however, that the March rebound was performed
-
NASDAQ on a W pattern.
- May 25, 2022
- Posted by: Tradingshot Articles
- Category: Stock Indices
Nasdaq (NDX) has been trading within a Channel Down since its All Time High in late November. The 1D RSI has turned sideways since April 26 and that resembles the flat period of February 01 – March 14. That was a W formation that rebounded and reached the overhead Resistance upon its completion. We
-
S&P500 First MACD Bullish Cross formed since March 15
- May 25, 2022
- Posted by: Tradingshot Articles
- Category: Stock Indices
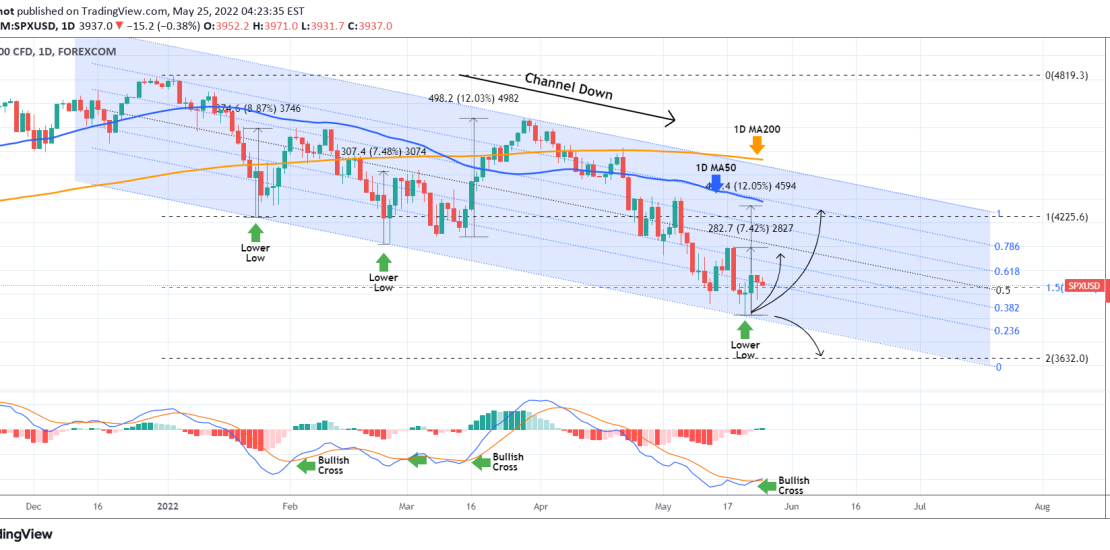
The S&P500 index (SPX) has been trading within a Channel Down ever since the January 04 2022 All Time High (ATH). Recently (May 20) it hit the Lower Low (bottom) trend-line of the Channel for the third time (Jan 24 and Feb 24 the others) and rebounded reaching the first Fibonacci extension (0.236 Fib).
-
DOW JONES 1 month target at 33170 unless the Low breaks.
- May 24, 2022
- Posted by: Tradingshot Articles
- Category: Stock Indices
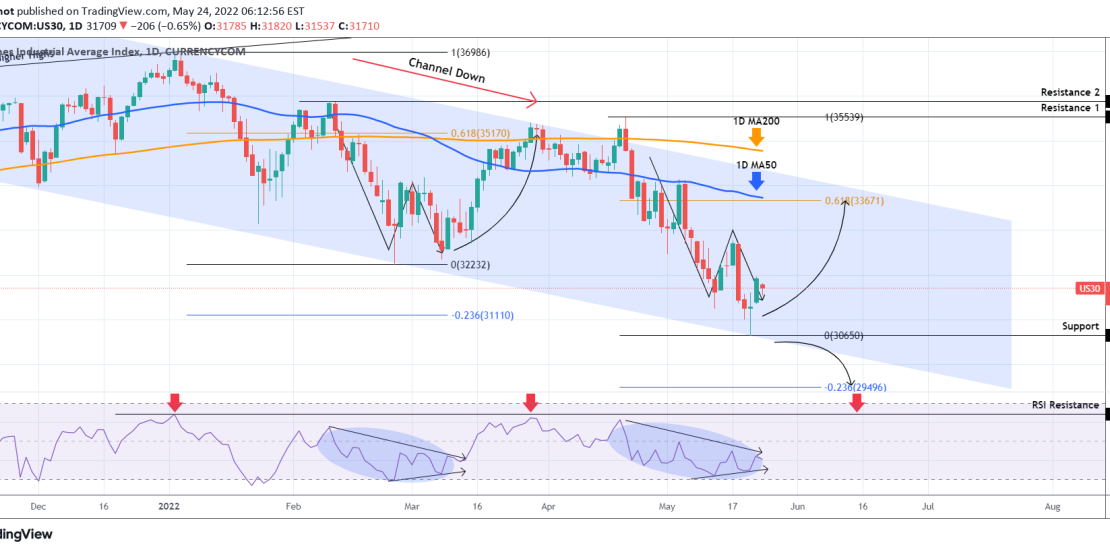
Dow Jones (DJI) has been trading within a Channel Down throughout this whole 2022 correction. Friday’s low along with the 1D RSI sequence, resemble the bottom fractal of the last Lower Low within the Channel Down on March 08. The index rebounded to just above the 0.618 Fibonacci retracement level at the time to
-
S&P500 against Bonds during Rate Hikes.
- May 20, 2022
- Posted by: Tradingshot Articles
- Category: Stock Indices
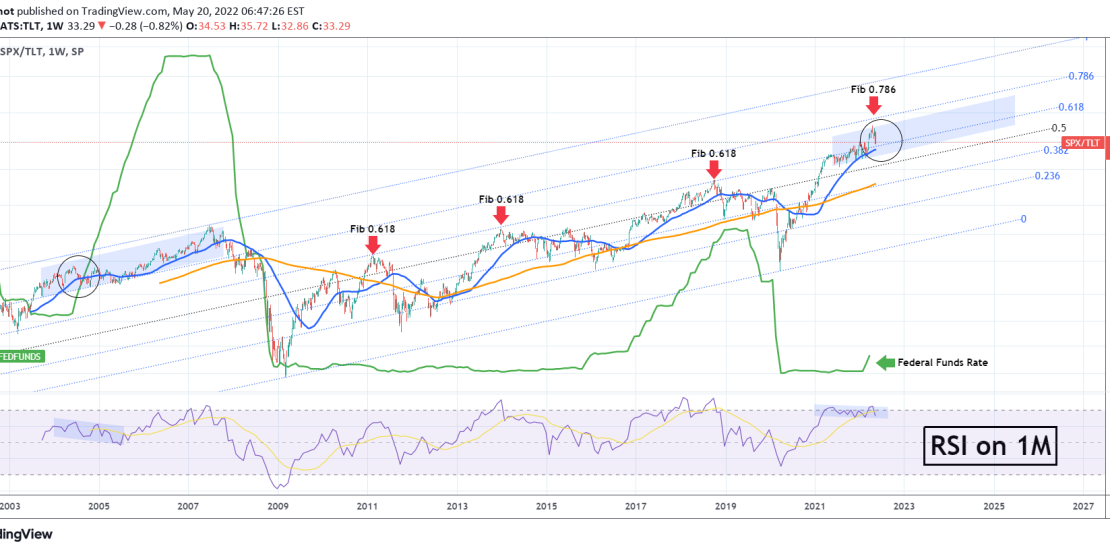
This chart displays the ratio of S&P500 against the 20+ Year Treasury Bond ETF on the 1W time-frame. The green trend-line represents the Federal Funds Rate. The RSI on the pane below the chart, is illustrated on the 1M time-frame and based on the Channel Down it has been since May 2021, it resembles
-
S&P500 The 6M chart that helps us not lose perspective
- May 19, 2022
- Posted by: Tradingshot Articles
- Category: Stock Indices
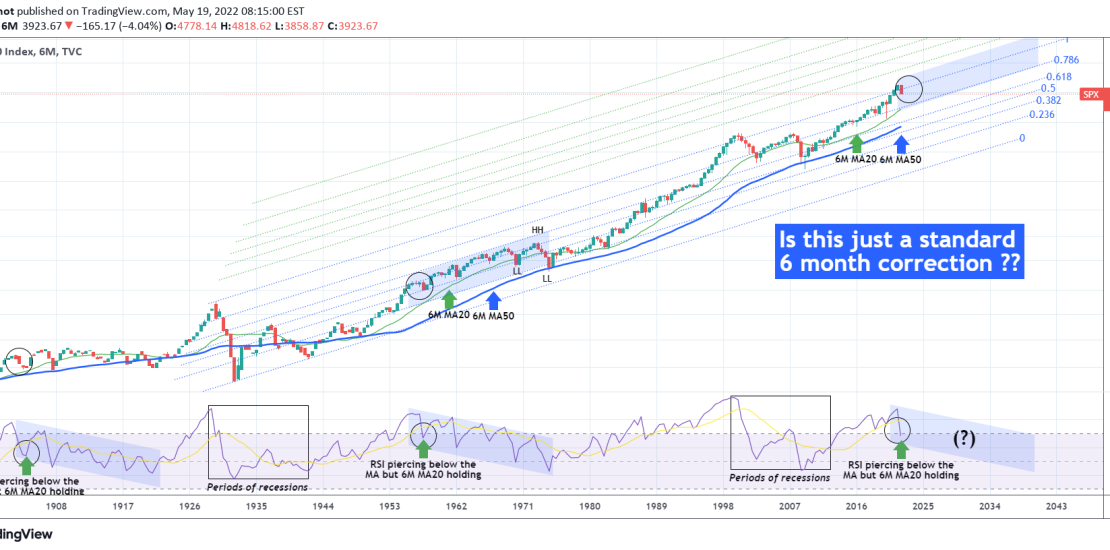
The Standard and Poor’s Index (S&P500 / SPX) has been on a strong correction these past roughly 6 months. For that reason, we present this analysis on the 6M time-frame, where every candle represents 6 months of price action. ** The RSI indicating where we are ** It is not a surprise that the
