

- May 26, 2022
- Posted by: Tradingshot Articles
- Category: Stock Indices
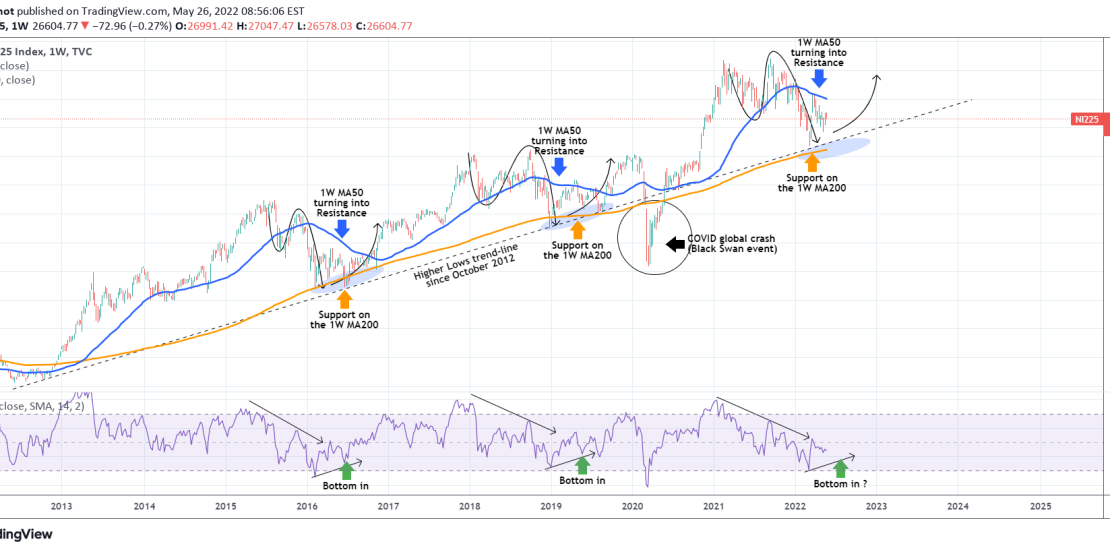
The Nikkei index (NI225) has been on a strong correction phase since its September Highs. Despite the early March rebound just above the 1W MA200 (orange trend-line), it was rejected on the 1W MA50 (blue trend-line) pulling the index back towards the lows.
Notice on this chart, however, that the March rebound was performed on a Higher Lows trend-line that is holding for almost 10 years, since October 2012. It was on that trend-line that Nikkei made the bottoms of June 2016, December 2018 and August 2019 and rebounded. Interestingly enough on all cases that was on or marginally around the 1W MA200. The only exception to that was the global asset crash of March 2020 due to the COVID pandemic, which of course is classified as a Black Swan event, and was the only time that the Higher Lows trend-line broke.
As a result, we have a 7 year sample of corrections that end with a bottom on the 1W MA200 and/or the Higher Lows trend-line. At the same time, when the 1W RSI makes Higher lows following an (near) test of the 30.00 oversold level, it indicates that the bottom of the correction is in and the index starts a new Bull Phase.
This indicates that the current level is a confirmed long-term buy opportunity on Nikkei.
Tradingview link: