

- May 25, 2022
- Posted by: Tradingshot Articles
- Category: Stock Indices
No Comments
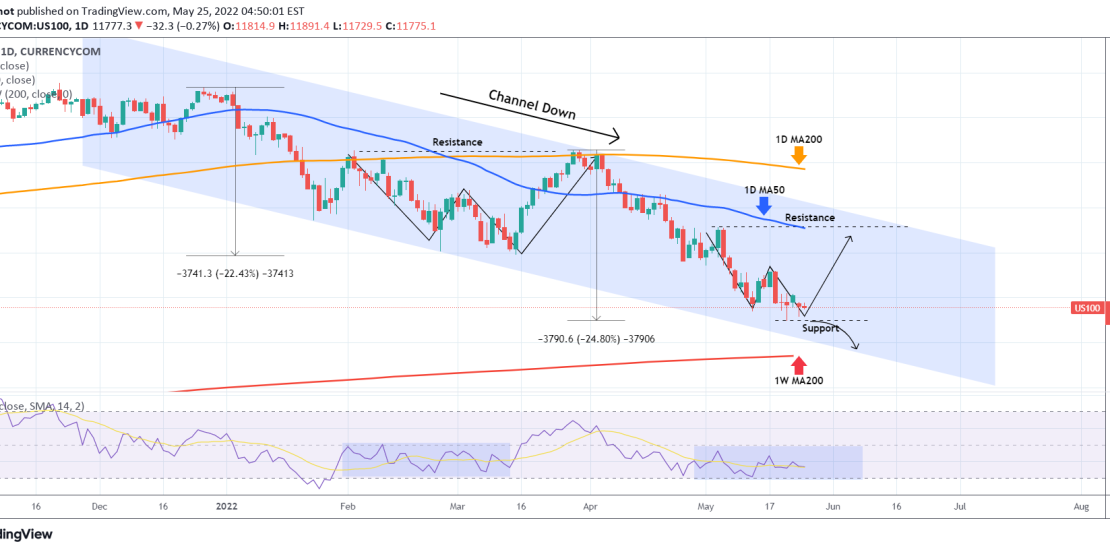
Nasdaq (NDX) has been trading within a Channel Down since its All Time High in late November. The 1D RSI has turned sideways since April 26 and that resembles the flat period of February 01 – March 14. That was a W formation that rebounded and reached the overhead Resistance upon its completion.
We may form a similar W pattern again with the Resistance this time being around 13580, which is where the 1D MA50 (blue trend-line) currently is. A break below the recent Support though, would invalidate this pattern and most likely push Nasdaq to the 1W MA200 (red trend-line), which is the long-term Support and has been untouched since July 06 2010!
Tradingview link:
https://www.tradingview.com/chart/US100/ydkYpWVS-NASDAQ-on-a-W-pattern