

- June 8, 2022
- Posted by: Tradingshot Articles
- Category: Stock Indices
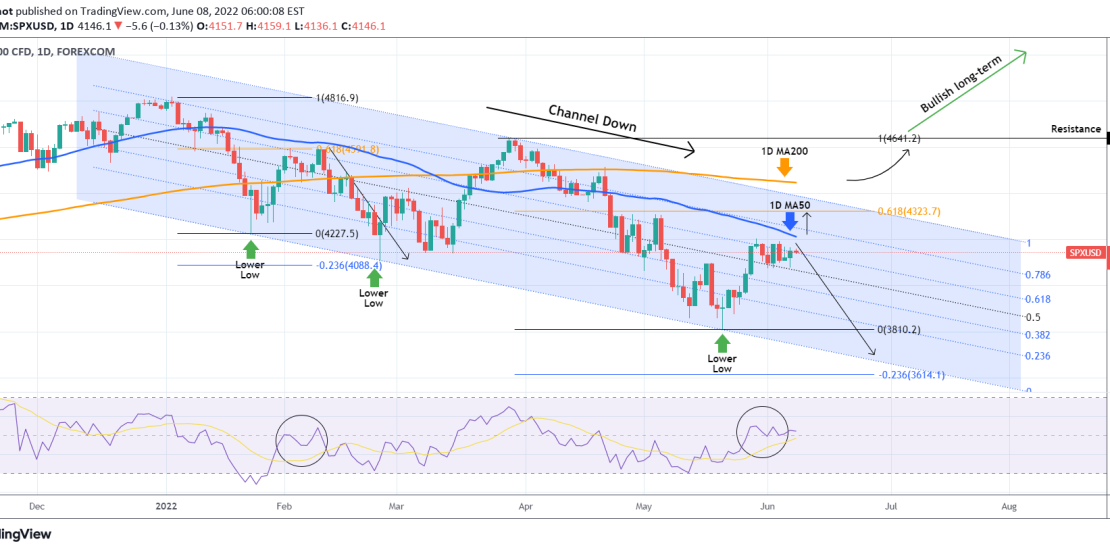
The S&P500 index (SPX) rose rapidly and almost hit its 1D MA50 (blue trend-line), which is the current Resistance, since our last post:

The long-term pattern remains a Channel Down since the All Time Highs (ATH), so the trend remains bearish towards the 3810 Support and quite possibly the -0.236 Fibonacci extension as a Lower Low. The fact that the price is struggling to break the 1D MA50, further strengthens this notion.
Even a break above the 1D MA50, won’t be enough to turn the price bullish long-term, only on the short-term towards the 0.618 Fibonacci retracement level, which was the Resistance level during the January 24 rebound. See how the 1D RSI is currently on similar levels.
A break-out buy signal wouldn’t be if the price closes above the 1D MA200 (orange trend-line), with a short-term target the 4640 Resistance (and March 29 High). Above the level, we can claim that the index has restored the long-term bullish trend.
Tradingview link:
https://www.tradingview.com/chart/SPXUSD/1y9wg5Ne-S-P500-The-1D-MA50-is-resisting-Scenarios-ahead