

- May 20, 2022
- Posted by: Tradingshot Articles
- Category: Stock Indices
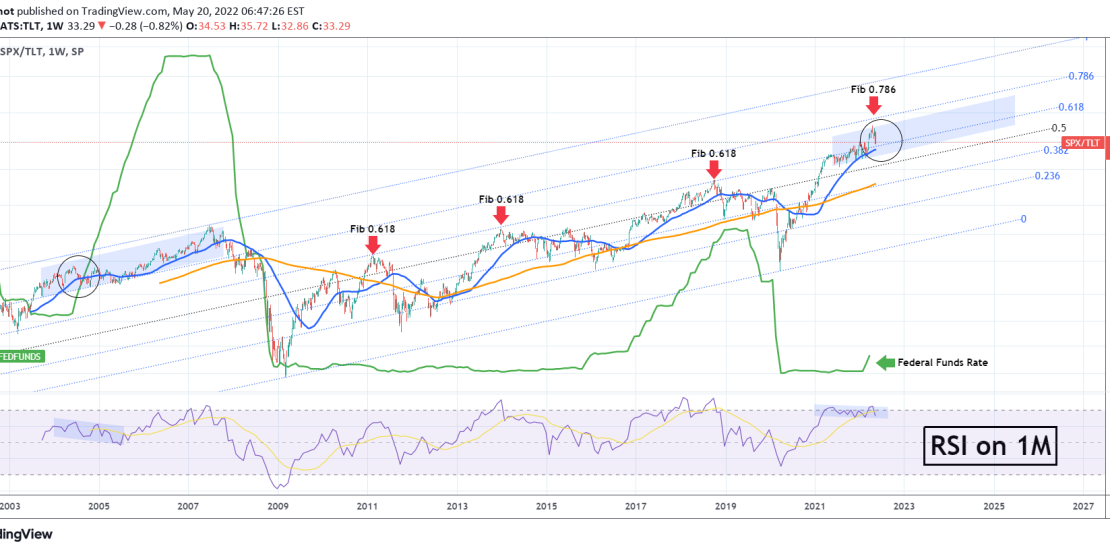
This chart displays the ratio of S&P500 against the 20+ Year Treasury Bond ETF on the 1W time-frame. The green trend-line represents the Federal Funds Rate. The RSI on the pane below the chart, is illustrated on the 1M time-frame and based on the Channel Down it has been since May 2021, it resembles more the price action of late 2003/2004. Interestingly enough, it was in mid 2004 that the Fed Rate has started to rise following the stock market recovery from the DotCom crash.
The Fibonacci Channel with the 0.236, 0.382, 05, 0.618, 0.786 retracement levels is applied on this ratio and since the stock market recovery from the 2007/08 Subprime Mortgage crisis, the Fib 0.618 band was the Resistance. Now it appears that we have moved a level higher on the 0.786 Fib. This model shows that there is no major crash ahead of us and most likely we will trade within those bands for a few years more before a bigger correction/ recession on the stock market.
Tradingview link:
https://www.tradingview.com/chart/SPX/x3oqBHeP-S-P500-against-Bonds-during-Rate-Hikes