
-
BITCOIN Is LTC a leading indicator to BTC’s Bull Cycle??
- November 4, 2022
- Posted by: Tradingshot Articles
- Category: Cryptocurrency
No Comments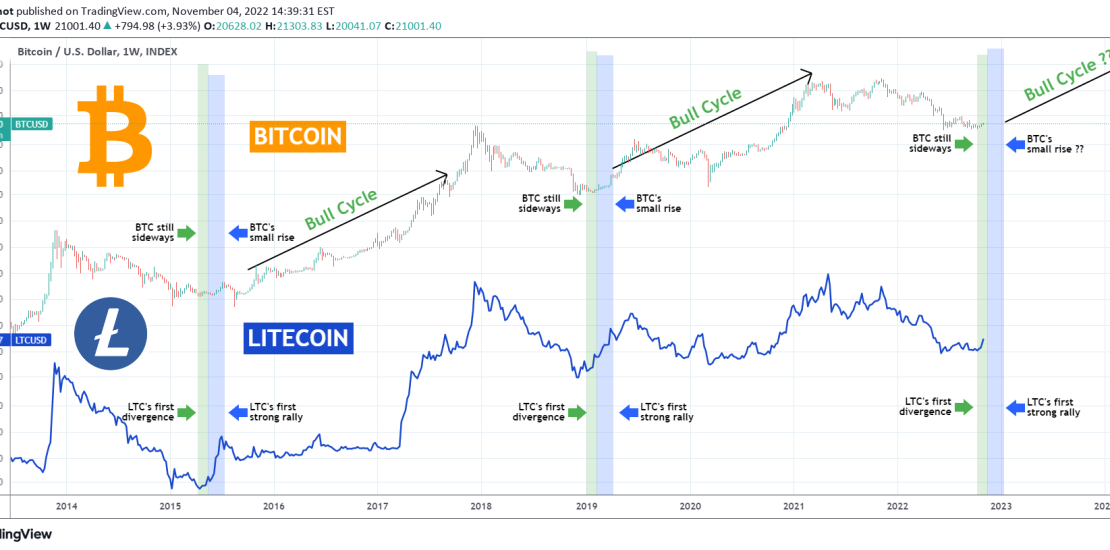
This is a chart on the 1W time-frame of Bitcoin (BTCUSD) and Litecoin (LTCUSD). This is not the first time we do this analysis, those who follow for long will know that during the previous BTC Cycle, right when it was consolidating after the December 2018 bottom, we used LTC’s price action to identify
-
EURUSD Confirmed Buy Signal. Bottom of Channel Up.
- November 4, 2022
- Posted by: Tradingshot Articles
- Category: Forex
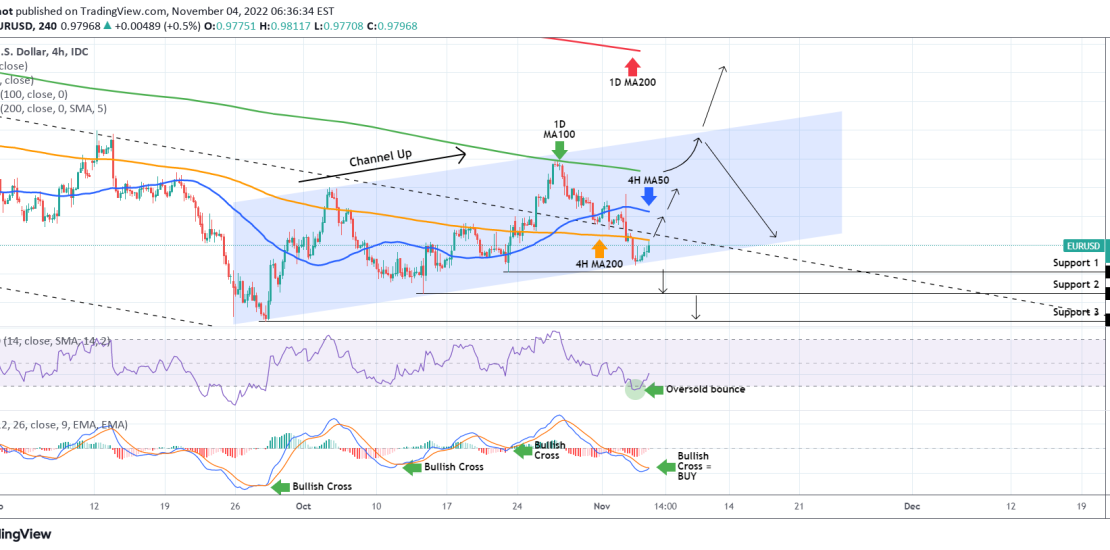
The EURUSD pair made yesterday a perfect Higher Low on the bottom of the Channel Up pattern that started on the September 28 2022 Low. The 4H RSI made an instant bounce after breaking below the 30.000 oversold territory but the biggest Buy Confirmation comes from the 4H MACD. As you see it is
-
S&P500 The inflation crisis is just a minor cyclical event!
- November 2, 2022
- Posted by: Tradingshot Articles
- Category: Stock Indices
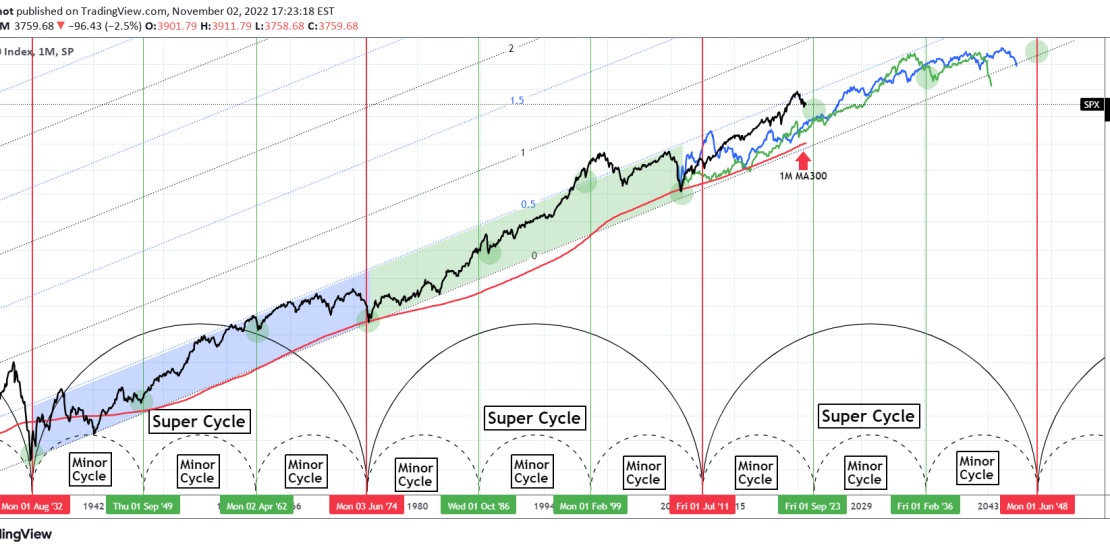
This is a complete roadmap of the S&P500 index (SPX) on the 1M time-frame, where we have taxonomized its historical trend on Super Cycles and Minor Cycles. As you see, since the Great Depression, we can categorize a whole era (approximately 42 years) as a Super Cycle. Super Cycles tend to end with a
-
OKBUSDT About to make a huge bullish break-out!
- October 31, 2022
- Posted by: Tradingshot Articles
- Category: Cryptocurrency

The OKB token (OKBUSDT) is the Global Utility Token that was launched by the OK Blockchain Foundation and OKX exchange in 2017, to serve as a bridge to connect OKX and its users. On this post, we will analyze how current pattern may be bullish short-term against popular belief and how it may play
-
APEUSDT Neutral within the Triangle. Wait for break-out.
- October 31, 2022
- Posted by: Tradingshot Articles
- Category: Cryptocurrency
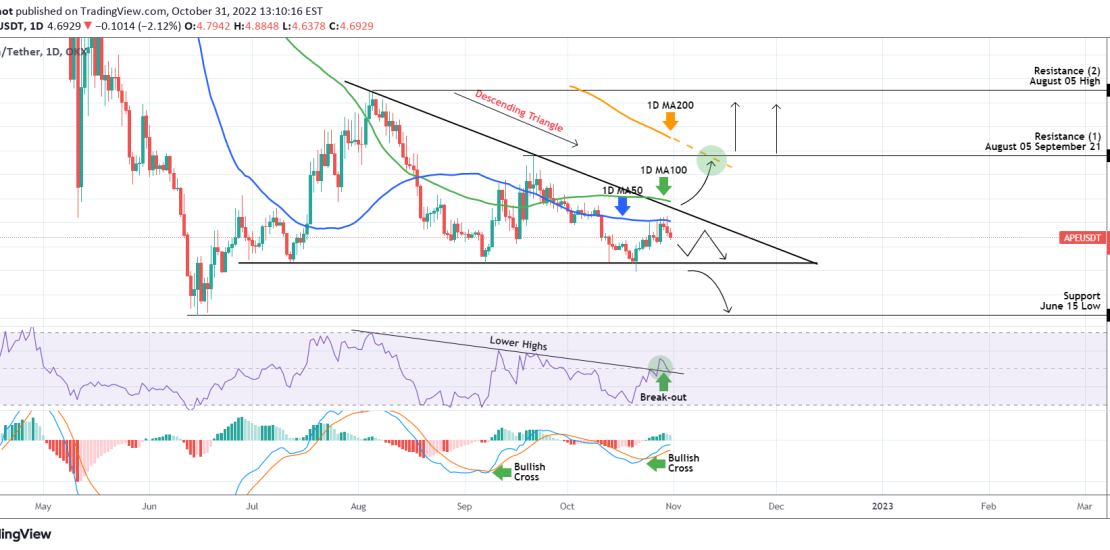
*** *** For this particular analysis on ApeCoin we are using the APEUSDT symbol on the OKX exchange. *** *** The idea is on the 1D time-frame where APE has been trading within a Descending Triangle pattern since the June 30 Low that started its Support. As you see the late price action is limited below the 1D MA50 (blue
-
XCNUSDT Rise short-term but still limited unless this breaks.
- October 31, 2022
- Posted by: Tradingshot Articles
- Category: Cryptocurrency
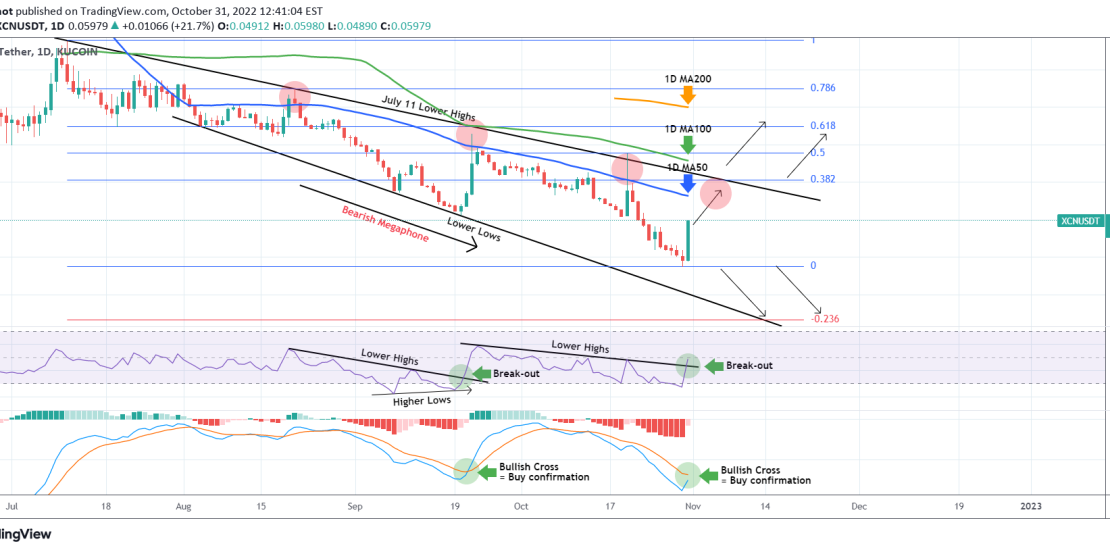
Chain (XCNUSDT) followed the pattern we suggested 40 days ago and after a short rise it dropped to the -0.236 Fibonacci extension level: As you see, today is having a +22% rise. The long-term pattern is a Bearish Megaphone on this 1D time-frame. This short-term rebound is aiming at the 1D MA50 (blue trend-line),
-
EURUSD Short-term Channel Up after the 1D MA100 rejection.
- October 31, 2022
- Posted by: Tradingshot Articles
- Category: Forex
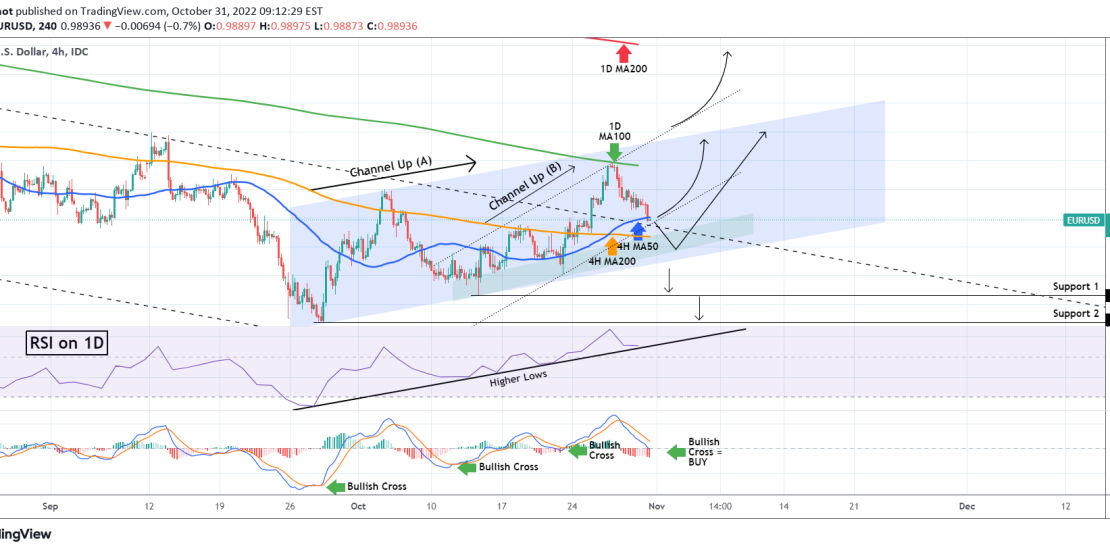
The EURUSD pair got emphatically rejected on its 1D MA100 (green trend-line) last Wednesday and as we discussed in our previous analysis, that was an instant short-term sell. Now the price is testing the 4H MA50 (blue trend-line), which along with the 4H MA200 (orange trend-line) form the short-term Support Zone. The rejection, confirmed
-
BITCOIN Fibonacci charts the new Bull Cycle! It’s already began!
- October 31, 2022
- Posted by: Tradingshot Articles
- Category: Cryptocurrency
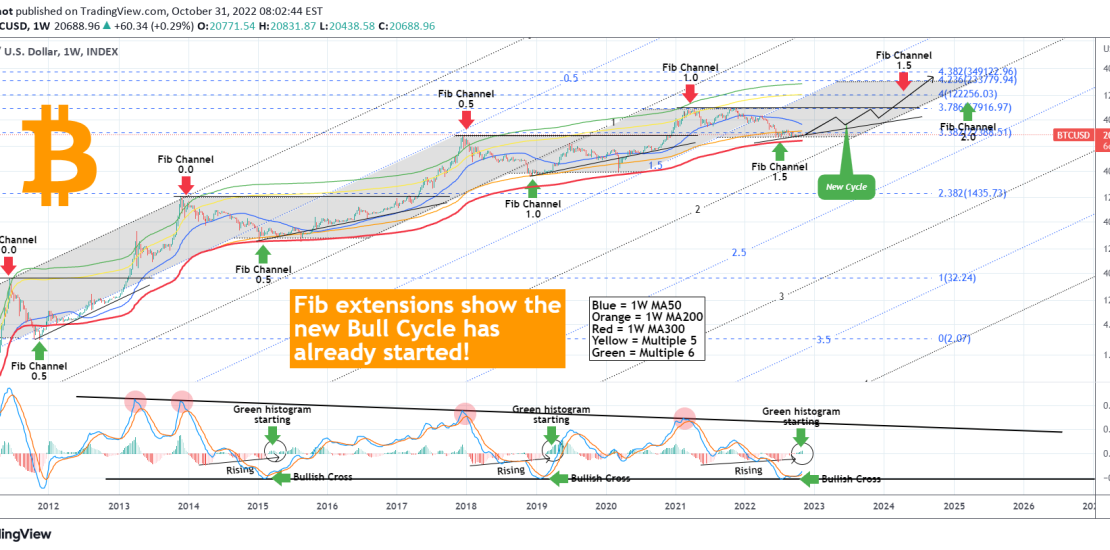
This is Bitcoin (BTCUSD) on the 1W time-frame displaying all of its Cycles historically. I’ve used the Fibonacci Channel extensions to identify any possible correlations and how this can create a roadmap moving forward and project the next Cycle. To start putting the chart’s indicators into perspective, the 1W MA50 is the blue trend-line,
-
DXY Can the Dollar keep falling ahead of next week’s Fed Rate?
- October 28, 2022
- Posted by: Tradingshot Articles
- Category: Forex
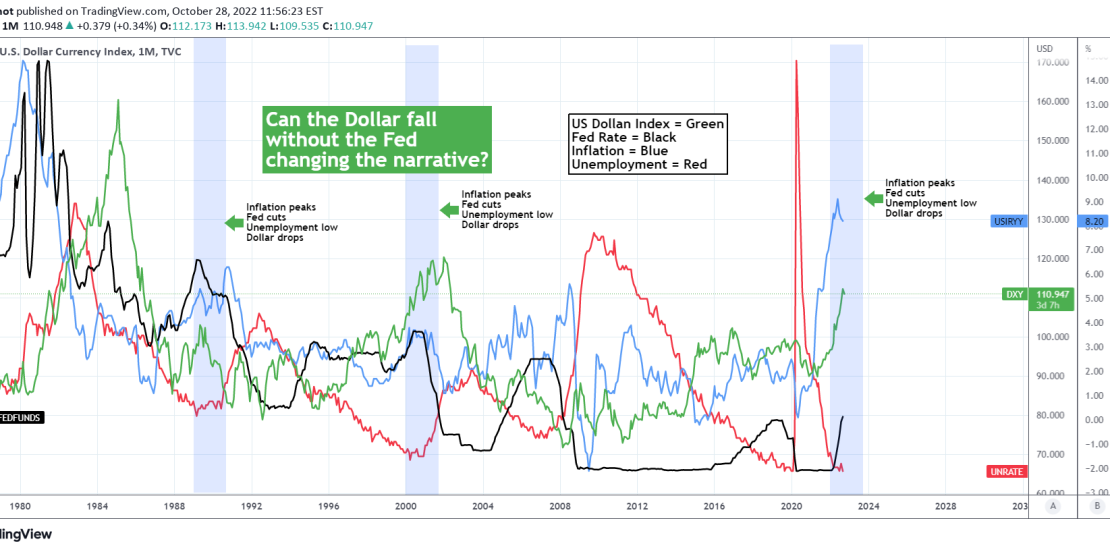
This 1M chart focuses on the U.S. Dollar Index (green trend-line), which is seeing its first serious and sustainable pull-back after a long time as since September 28 it has been trading on Lower Highs and Lower Lows (not seen on this monthly time-frame though). This week the low completed a -4.50% from its
-
BITCOIN The winning signal for the new Bull Cycle!
- October 28, 2022
- Posted by: Tradingshot Articles
- Category: Cryptocurrency
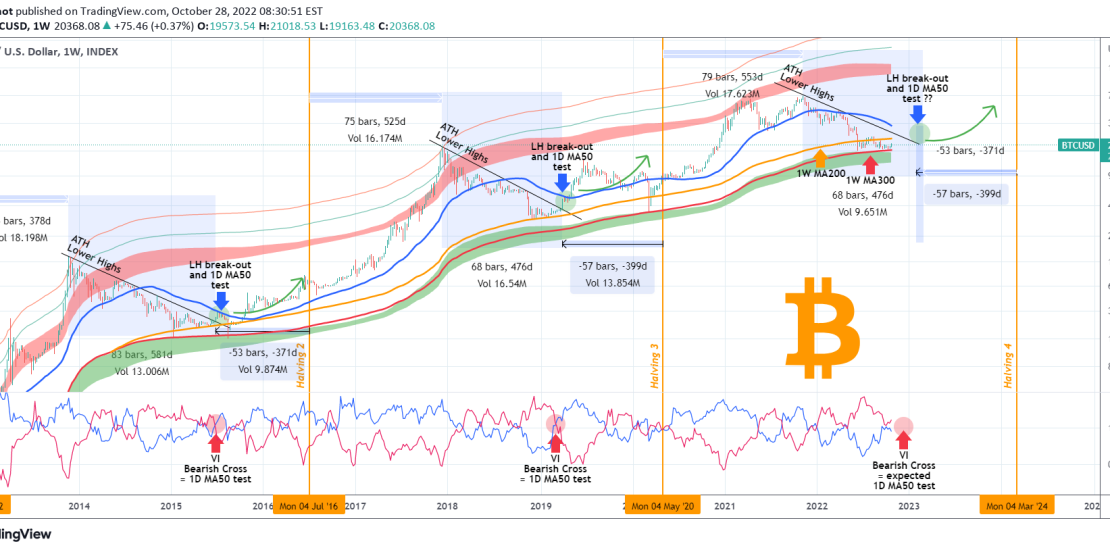
This is Bitcoin (BTCUSD) on the 1W time-frame, where we will be basically adding elements and making an extension of our June 17 idea that projected the bottom on the 1W MA300 (red trend-line): As you see, BTC hit the 1W MA300, the Ultimate Support Band as we called it and since then traded
