

- November 4, 2022
- Posted by: Tradingshot Articles
- Category: Cryptocurrency
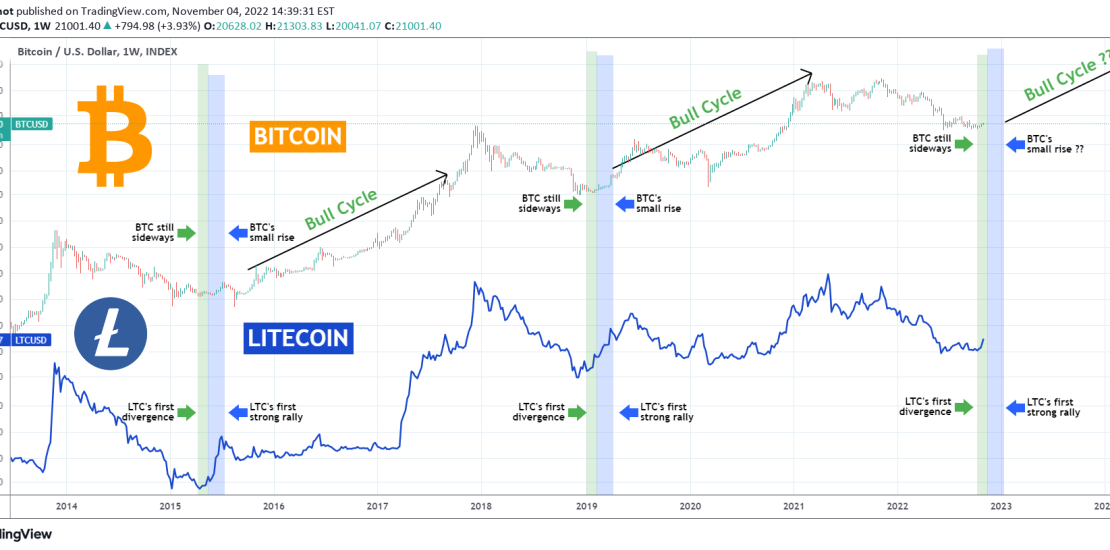
This is a chart on the 1W time-frame of Bitcoin (BTCUSD) and Litecoin (LTCUSD). This is not the first time we do this analysis, those who follow for long will know that during the previous BTC Cycle, right when it was consolidating after the December 2018 bottom, we used LTC’s price action to identify similarities with historic price runs.
And yes, in the past two Cycles, Litecoin has been an excellent leading indicator to Bitcoin, showing the way with a first rally into the market’s new Bull Cycle. As you see on the chart, LTC right after the market bottom, tends to make an initial rally and diverge from BTC while it is still sideways (green zone). Shortly after, LTC explodes to the upside with a strong rally, while BTC only posts a small rise (blue zone). Right after this, the Bull Cycle begins officially.
Litecoin has been rising since mid October, diverging significantly from Bitcoin. We can claim that we are already in a new Green Zone as at the same time Bitcoin is trading sideways. Do you think this correlation will play out once more? And if so, should we expect a small rise for Bitcoin in the final two months of 2022 and a new Bull Cycle starting as early as next year? Feel free to let me know in the comments section below!
Tradingview link: