
-
BITCOIN and S&P500 Has a 10 year Bull phase just started?
- December 11, 2022
- Posted by: Tradingshot Articles
- Category: Cryptocurrency
No Comments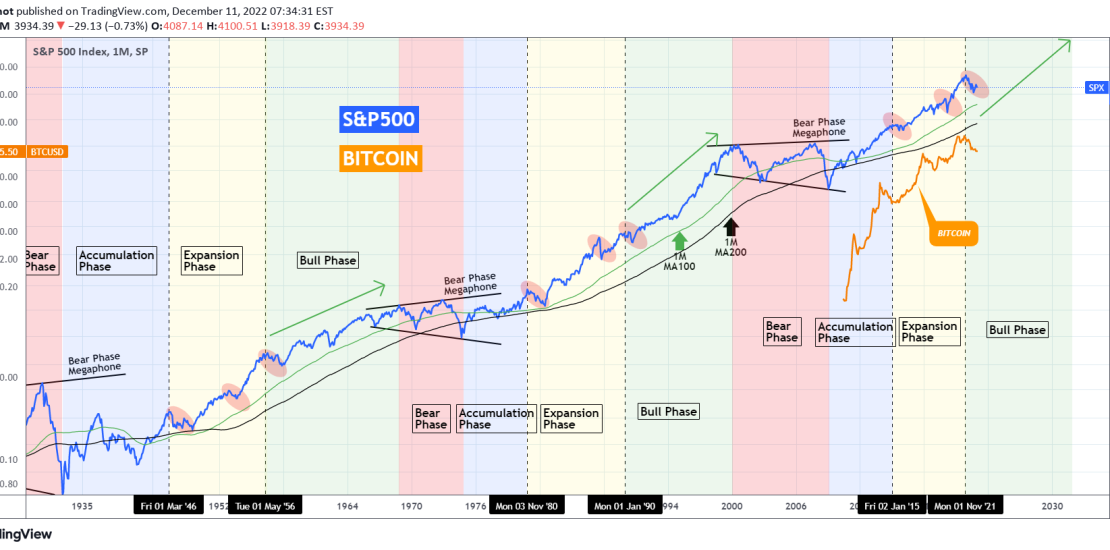
A 1 year correction which is nothing but common throughout Bitcoin’s (BTCUSD) existence, has done its work well in spreading fear and doubt at the market during this inflationary stock crisis in 2022. In times like this what helps the most is to maintain a long-term perspective and look at how history reacted in
-
DAX 1D Golden Cross is bullish but mid-term indicates volatility
- December 9, 2022
- Posted by: Tradingshot Articles
- Category: Stock Indices
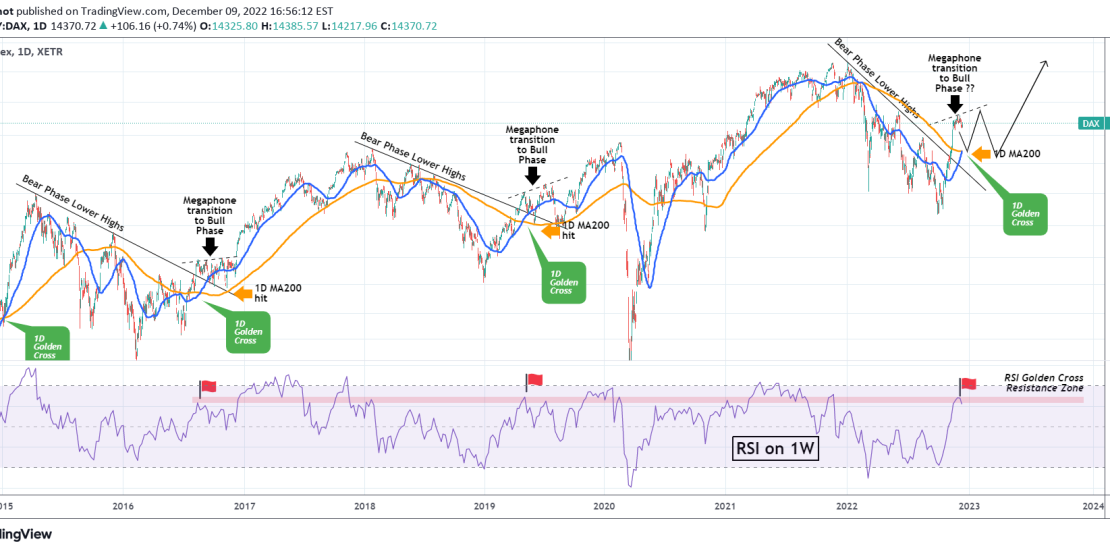
Today the German stock market (DAX) completed a Golden Cross pattern on the 1D time-frame, which is when the 1D MA50 (blue trend-line) crosses above the 1D MA200 (orange trend-line). That is technically a bullish formation and that is what we interpret it as, at least on the long-term. Historically a 1D Golden Cross
-
BITCOIN, Yuan and China bond yields point to rally ahead!
- December 9, 2022
- Posted by: Tradingshot Articles
- Category: Cryptocurrency
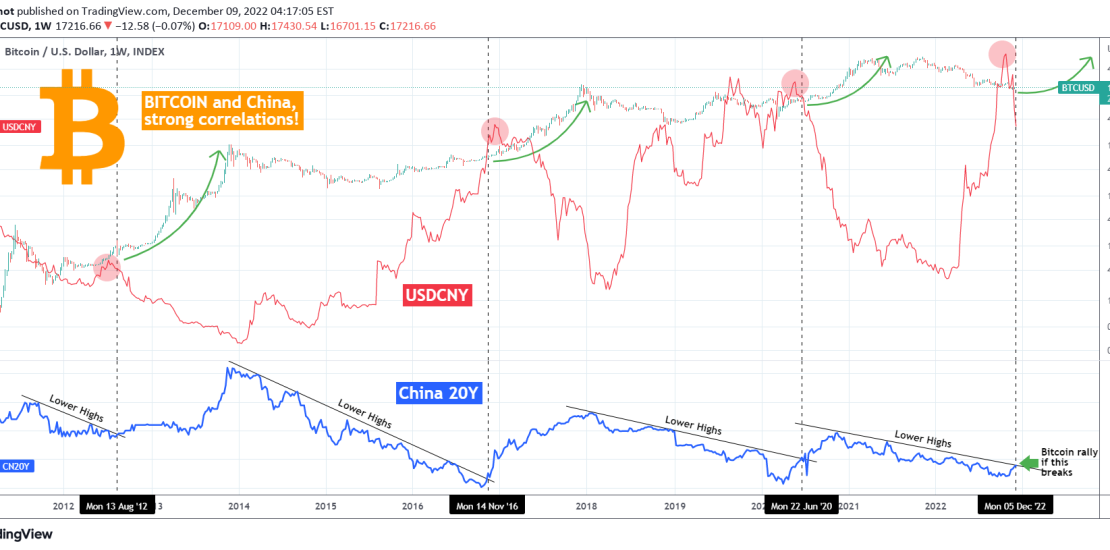
You might be thinking what the Chinese Yuan (USDCNY displayed by the red trend-line) and China’s bond yields (CN20Y displayed by the blue trend-line) have to do with BITCOIN (BTCUSD). This chart comes to show just how strong the correlation is. As you see since 2012, every time the CN20Y broke above its Lower
-
PROCTER & GAMBLE Rejection approaching. Expect ~$140.
- December 8, 2022
- Posted by: Tradingshot Articles
- Category: Stocks
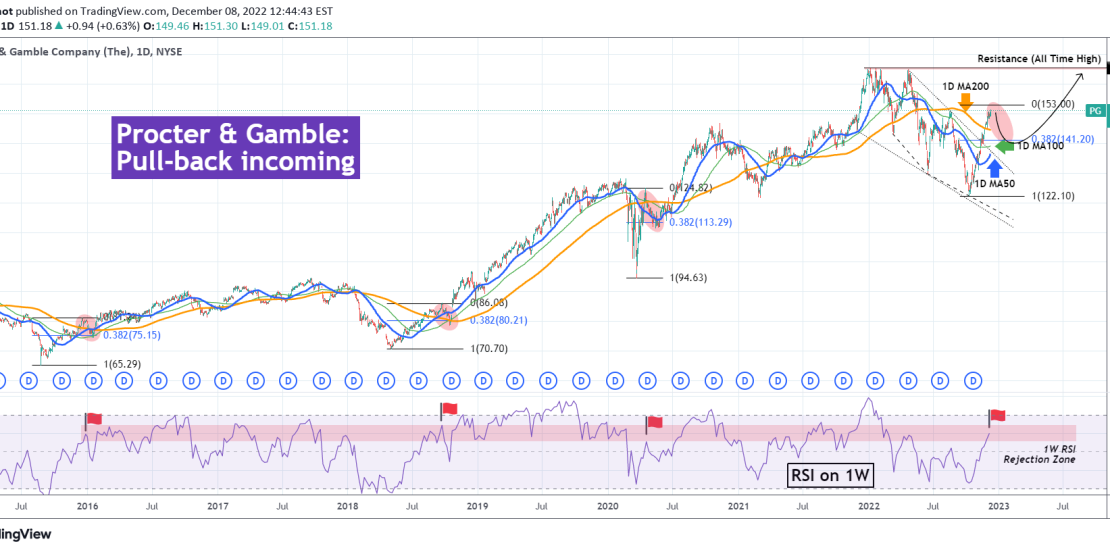
Procter & Gamble (PG) has been on a relentless +23% 2-month rally (since October 10), breaking above all possible MA levels: the 1D MA50 (blue trend-line), the 1D MA100 (green trend-line) and the 1D MA200 (orange trend-line). Today it even broke above the August 16 High, the technical Resistance, making the first Higher High
-
NASDAQ Almost 1 month trapped within the 1D MA50 – MA100
- December 8, 2022
- Posted by: Tradingshot Articles
- Category: Stock Indices
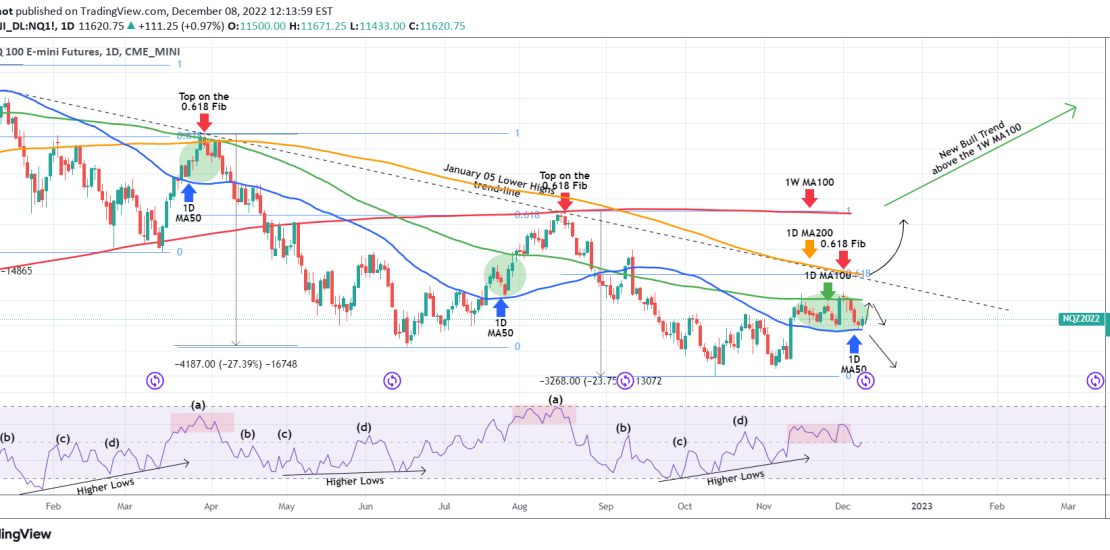
Nasdaq (NDX) has been trading sideways since November 10, with the 1D MA50 (blue trend-line) as Support and the 1D MA100 (green trend-line) as Resistance. On a wide scale, this technically looks like the previous two market tops on the January 05 Lower Highs trend-line, and the 1D RSI illustrates that clearly. However, the
-
DOW JONES ready to rally! Inflation peaked on a 100 year line!
- December 8, 2022
- Posted by: Tradingshot Articles
- Category: Stock Indices
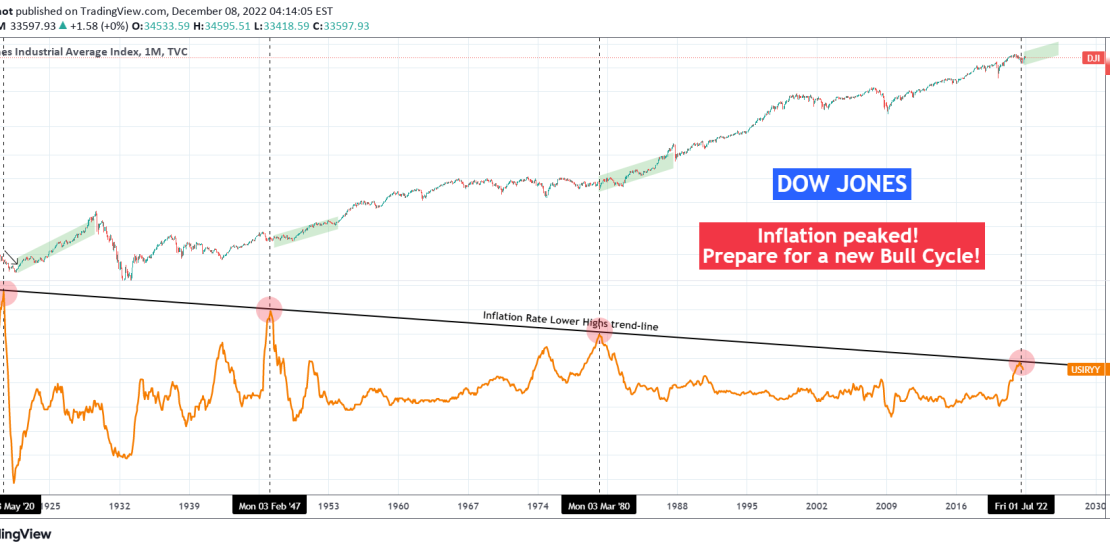
The Dow Jones index (DJI) has been on an enormous rise since late September that even made a Higher High above the 2022 descending Resistance. With inflation being the main catalyst of this 2022 correction, it should come as no surprise that when it normalizes, the index can start seeing growth again. Well on
-
BITCOIN The Golden 51%-49% Ratio is back! Is this the next top?
- December 5, 2022
- Posted by: Tradingshot Articles
- Category: Cryptocurrency
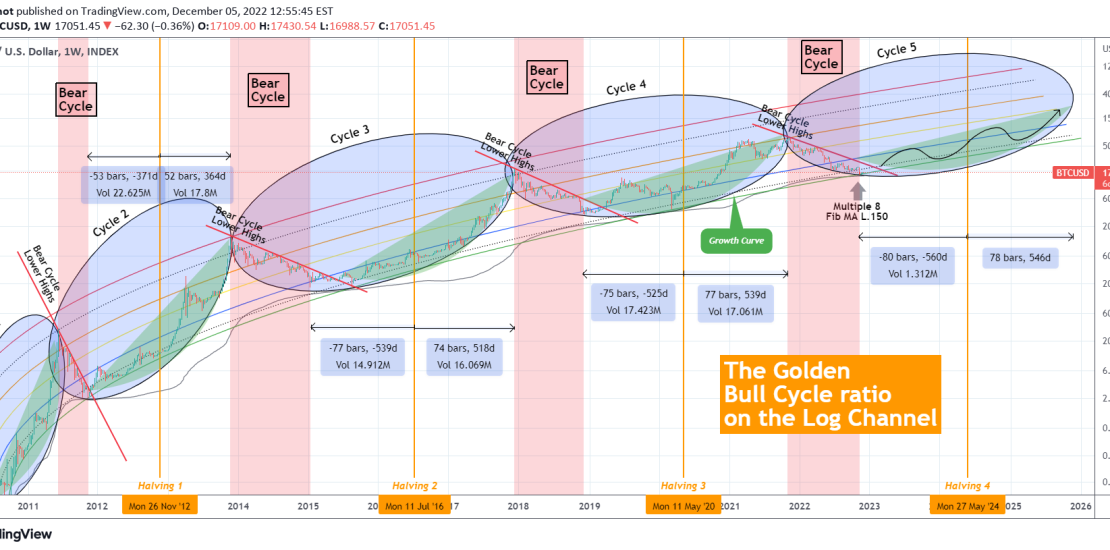
After the interest that the revised version of my Logarithmic Channel model attracted, I thought I’d extend it by adding a few more elements, most notable of which Tradingshot’s very own Golden 51%-49% Ratio! Basically I’ve been asked continuously to make an update on that legendary chart, so here is an extension, though I
-
BITCOIN Long and painful but necessary bottom process!
- December 3, 2022
- Posted by: Tradingshot Articles
- Category: Cryptocurrency
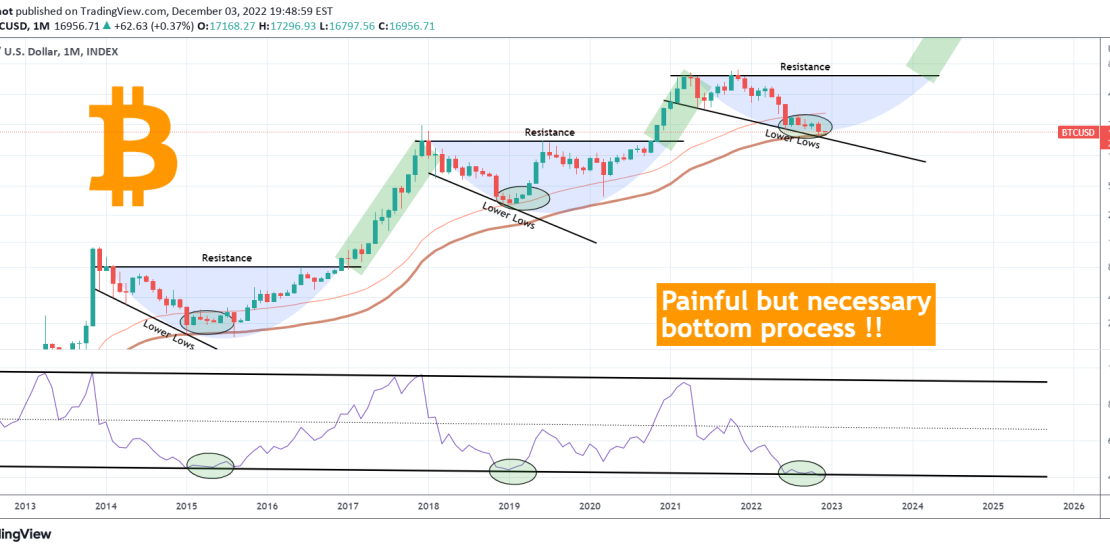
We rarely post Bitcoin (BTCUSD) analyses on the 1M (monthly) time-frame, but this one does justice is showing the complete long-term picture. On a monthly basis, Bitcoin has been forming a bottom since the June Low, within a zone formed by the Fibonacci MA and Multiple 1. At the same time the 1M RSI
-
USDJPY The only chart you’ll need for the next 10 years!
- December 3, 2022
- Posted by: Tradingshot Articles
- Category: Forex
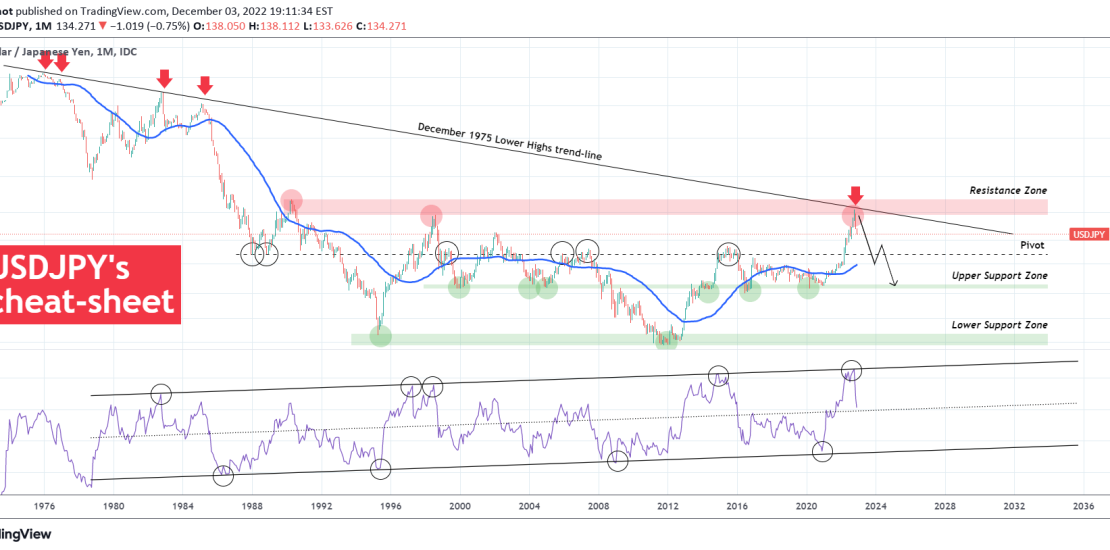
This is the USDJPY pair on the 1M chart. The October rejection and subsequent deep red November may have come as a surprise to many but not if they’ve had been paying attention to this multi-decade chart that clearly shows the rejection was on a major, historic Resistance cluster. Before we begin, note that
-
BITCOIN Log Growth Curve the only pattern that matters right now
- December 2, 2022
- Posted by: Tradingshot Articles
- Category: Cryptocurrency
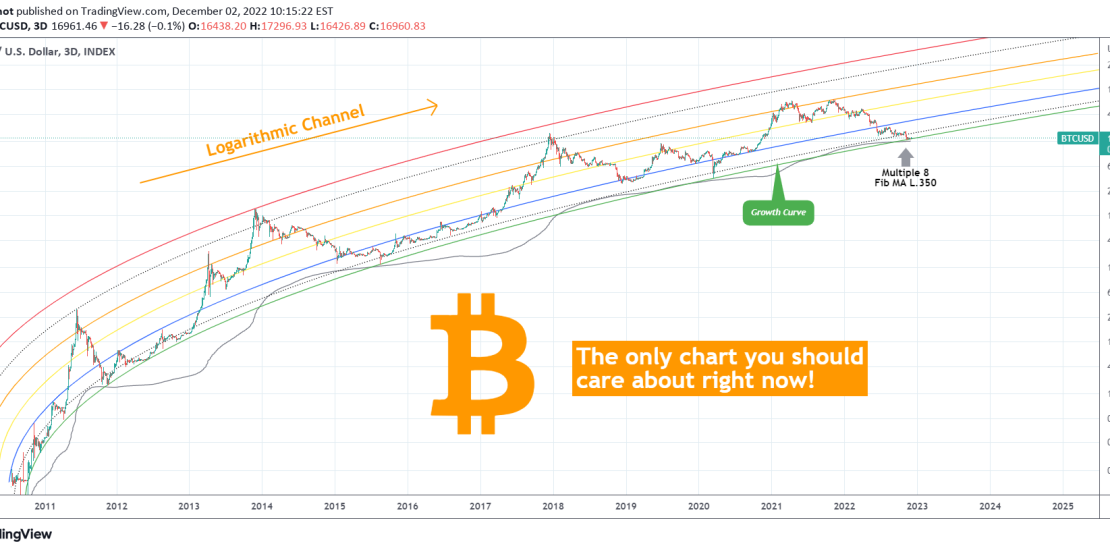
On this chart we seen Bitcoin (BTCUSD) on its historic Logarithmic Channel (LC), the channel that has been trading in since its inception and will put emphasis on its Growth Curve which is the pattern we popularized here since early 2019. See how well the model has been containing the price action going more
