

- December 3, 2022
- Posted by: Tradingshot Articles
- Category: Forex
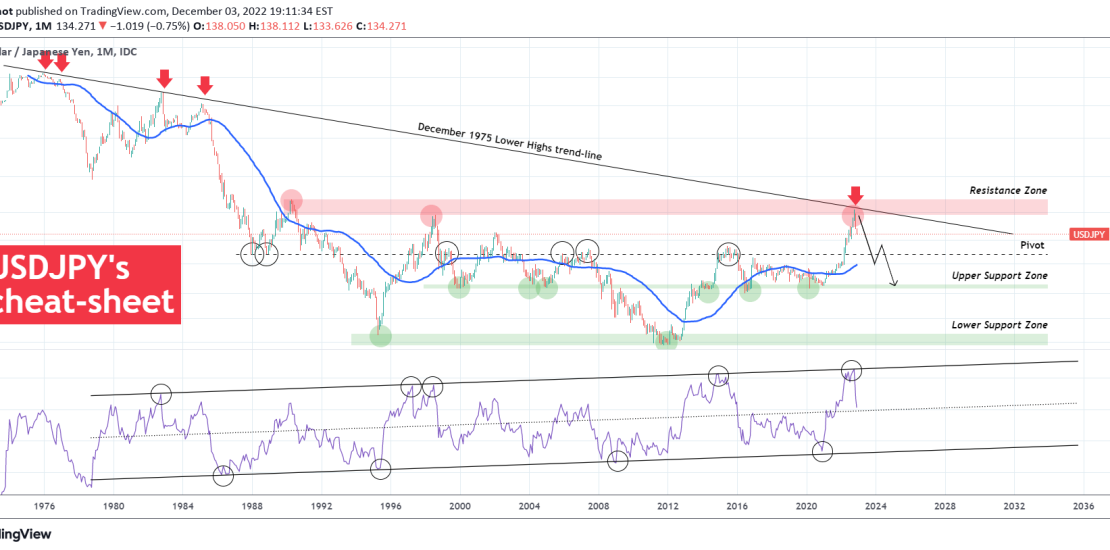
This is the USDJPY pair on the 1M chart. The October rejection and subsequent deep red November may have come as a surprise to many but not if they’ve had been paying attention to this multi-decade chart that clearly shows the rejection was on a major, historic Resistance cluster.
Before we begin, note that the October mega rejection was something we called for and clearly showed on our October 15 analysis, even on the short-term:

Back to the multi-decade chart, as you see, this cheat-sheet shows all of USDJPY’s major pressure points/ zones through the years that act either as Resistance or Support levels depending on the trend.
With regards to October’s rejection, we clearly see that this was made on a Lower Highs trend-line that was holding since December 1975, while the 1M RSI hit the top of a Channel Up that started after the October 1978 Low! On a large multi-year scale, there couldn’t have been a better sell signal than that on USDJPY.
As for the targets? The next pressure level in line is the 120.500 Pivot, where the price can make contact with the 1M MA50 (blue trend-line). A full-year rebound or consolidation after achieving that long-term target, can finally push for a test of the Upper Support Zone that is basically supporting USDJPY since January 2014.
Tradingview link: